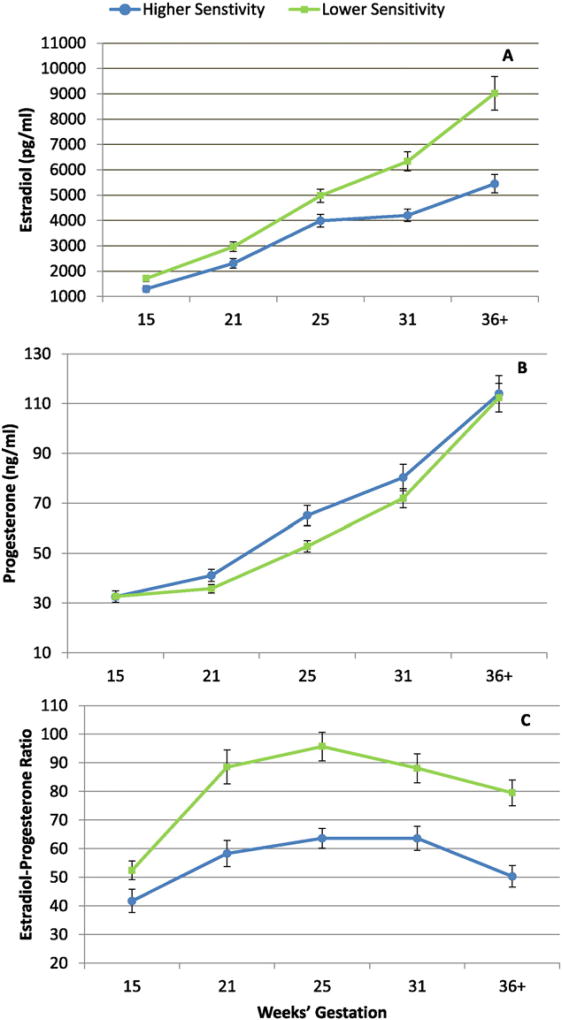
Fig. 1.
Gestational trajectories of estradiol (A), progesterone (B) and the estrogen to progesterone ratio (C). Means and standard errors of top and bottom quartiles of maternal sensitivity at 12-months post-partum are plotted only for illustrative purposes. In all statistical analyses, sensitivity was treated as a continuous variable.

