
Figure 1. Age-Dependent Transcriptome Signatures in Fibroblasts and Derived iPSCs.
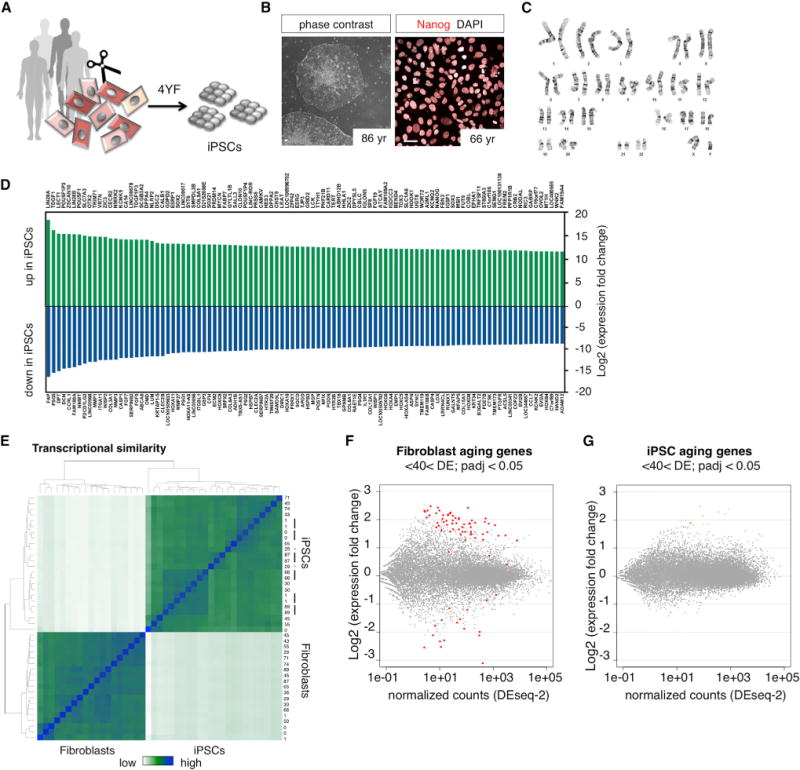
(A) iPSC reprogramming of young and old donor fibroblasts using the four Yamanaka-factors (4YF).
(B) Phase contrast images and immunocytochemical characterization of human iPSCs stained with Nanog. The scale bars represent 20 μm.
(C) Representative image for karyotype analysis of iPSC clones with G-banding (all included lines tested normal).
(D) Differentially expressed genes between fibroblasts and iPSCs. The top 100 up and downregulated genes are shown (extended data in Table S2).
(E) Heatmap showing hierarchical clustering of transcriptome similarity of fibroblasts and derived iPSCs. The black bars indicate multiple iPSC clones from the same donor that cluster together, and the * indicates lines from the same donor that do not cluster together.
(F and G) MA plot shows differential expression between young (<40 year) and old (>40 year) fibroblasts and iPSCs (one clone per donor used for analysis). The colored dots indicate significant aging genes (padj < 0.05) (extended data in Table S3).