
Figure 7. RanBP17 Decrease Causes Loss of NCC and iPSC Reprogramming Restores NCC in Old Donor-Derived Cells.
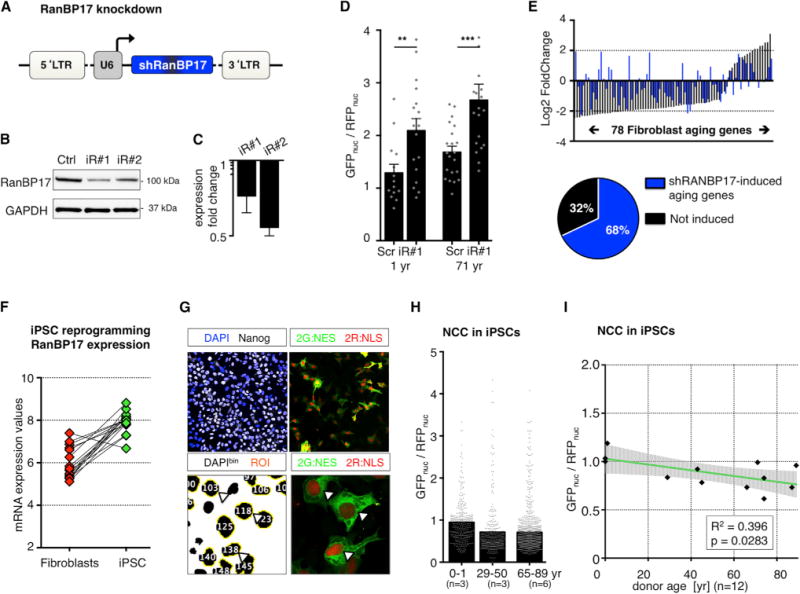
(A) Lentiviral vector for RanBP17 knockdown (shRNAs: iR#1 and iR#2).
(B) Western immunoblotting for RanBP17 in cells expressing iR#1, iR#2, or scrambled control shRNA.
(C) qPCR analysis for iR#1 and iR#2 compared to scrambled control.
(D) GFPnuc/RFPnuc ratios in young (1 year, left) and old (71 year, right) RanBP17 knockdown cells. The bar graphs show mean, and the dots indicate single cells (significance values: *p < 0.05; **p < 0.01; ***p < 0.005, and ****p < 0.001).
(E) Fibroblast aging genes in response to RanBP17 knockdown. The graph shows expression changes (old versus young) of the 78 fibroblast aging genes in response to aging (black bars) and in response to RanBP17 knockdown in young fibroblasts (1 year). The RanBP17 knockdown caused 68% of the aging genes to change in the same direction as in aging.
(F) RanBP17 mRNA levels in fibroblasts (red) and corresponding iPSCs (green; VST normalized counts).
(G) Monolayer PluriPro culture of iPSCs for the measurement of NCC.
(H) GFPnuc/RFPnuc ratios in iPSCs reprogrammed from young and old donors (n = 12 donors). The bars represent means, and the dots represent individual cells.
(I) Correlation of NCC with donor age in iPSCs. The black dots represent individual donor iPSCs. The green line represents the linear regression fit, and the shaded area is the 95% confidence interval.
Also see related Figure S7.