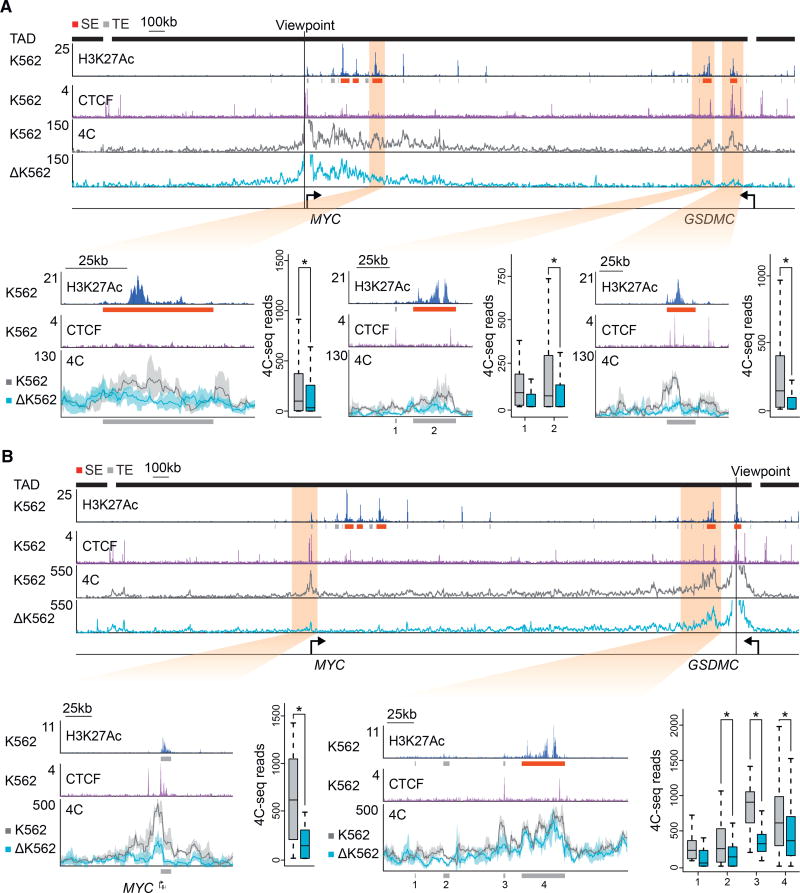
Figure 3. Perturbation of the MYC Enhancer-Docking Site Reduces Looping to Super-Enhancers.
(A) 4C analysis showing reduced looping of the MYC promoter proximal CTCF site to super-enhancers in CTCF motif deletion cells (ΔK562) versus unmodified cells (K562). H3K27Ac ChIP-seq and CTCF ChIP-seq are shown in blue and purple colors respectively. Blowups show the 4C interactions for three K562 specific super-enhancers. The 4C viewpoint is situated 112 base pairs upstream of the deleted loop-anchor region.
(B) 4C analysis showing reduced looping of the MYC promoter proximal CTCF site to super-enhancers in CTCF motif deletion cells (ΔK562) versus unmodified cells (K562) using a viewpoint centered on the most distant super-enhancer downstream of the MYC gene. H3K27Ac ChIP-seq and CTCF ChIP-seq are shown in blue and purple, respectively. Blowups show the 4C interactions at the MYC promoter and distant super-enhancer near the viewpoint. Shading represents the 90% confidence interval based on three biological replicates. Peak calls from the H3K27Ac ChIP-seq were used to define the regions to be quantified and are indicated in gray boxes at the bottom of the panels. Boxplots show quantification of the reads per fragment for the indicated regions. p values were generated using Student’s t test, and data pairs with a p value < 0.05 are indicated with an asterisk. Reads are shown in reads per million sequenced reads per base pair. Typical enhancers and super-enhancers are shown as gray boxes and red boxes, respectively.
See also Figure S3

