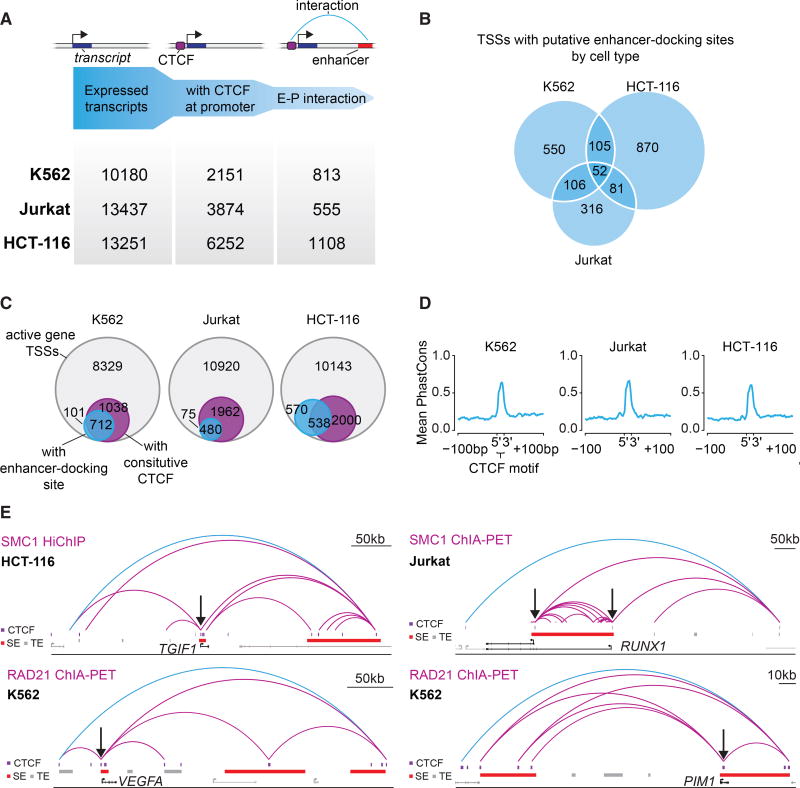
Figure 5. Putative Enhancer-Docking Sites Occur at Additional Genes with Prominent Roles in Cancer.
(A) Identification of genes with putative enhancer-docking sites. Genes were filtered for their expression status, presence of a CTCF binding site within 2.5 kb of the TSS and evidence of looping to an active enhancer, defined by H3K27Ac ChIP-seq.
(B) Venn-diagram showing the overlap of TSSs with putative CTCF enhancer docking in K562, HCT-116, and Jurkat cells.
(C) Venn-diagrams showing the number of TSSs from active genes, the number of these that exhibit putative CTCF enhancer-docking and how many of these have a constitutive CTCF site within 2.5 kb of the TSS.
(D) Conservation analysis of the CTCF motifs in the CTCF-bound elements in putative enhancer-docking sites. The mean 46-way PhastCons score of the highest JASPAR scoring motifs in CTCF peaks within putative CTCF enhancer docking and their flanking regions are shown.
(E) Examples of genes with putative CTCF enhancer-docking sites from the different cell types analyzed. CTCF ChIP-seq peaks are shown as purple rectangles, typical enhancers are shown as gray rectangles, and super-enhancers are shown as red rectangles. Black arrows indicate the CTCF sites that may facilitate enhancer docking. The insulated neighborhood loop is shown in blue and loops internal to it are shown in purple. HCT-116 HiChIP interactions internal to the neighborhood with an origami score of at least 0.9 and a minimum PET count of 15 are shown for the TGIF1 locus. Jurkat SMC1 ChIA-PET interactions internal to the neighborhood with an origami score of at least 0.97 are shown for the RUNX1 locus. K562 RAD21 ChIA-PET interactions internal to the neighborhood with an origami score of at least 0.9 and a minimum PET count of 30 are shown for the VEGFA locus. K562 RAD21 ChIA-PET interactions internal to the neighborhood with an origami score of at least 0.9 and aminimum PET count of 30 are shown for the PIM1 locus. Data are from this study and two others (Hnisz et al., 2016a; Heidari et al., 2014).
See also Figure S5

