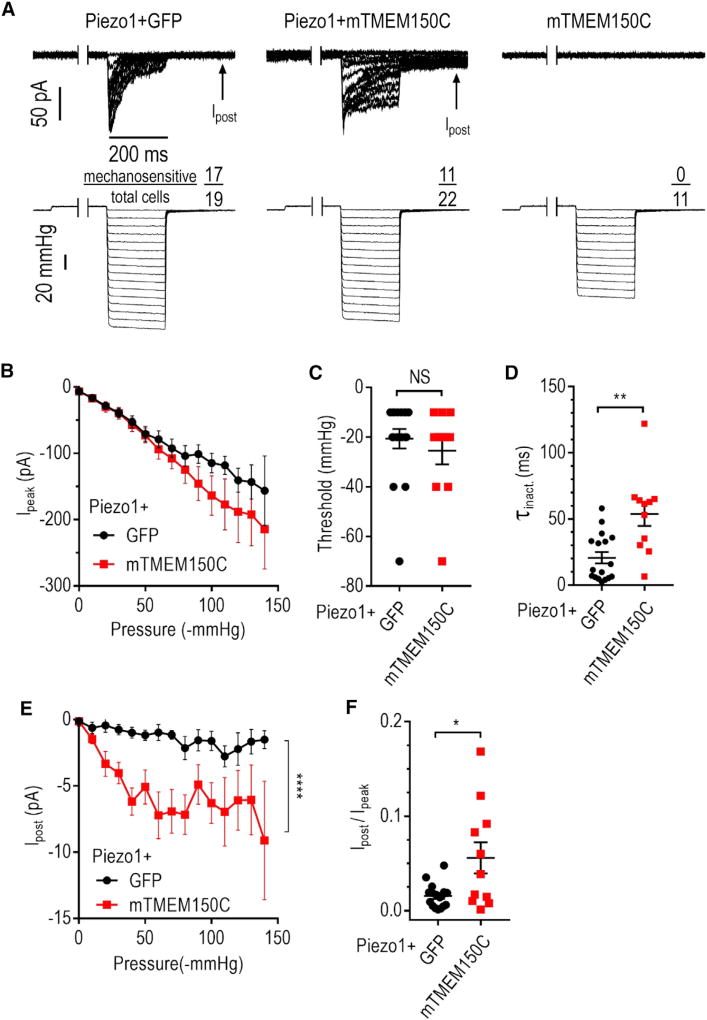
Figure 3. TMEM150C Potentiates Piezo1 MA Current Evoked by High-Speed Pressure Clamp.
(A) Exemplar cell-attached MA current traces recorded in HEK293TΔP1 cells in response to application of a negative pressure in the pipette at Ehold = −60 mV. Each pressure step was preceded by a 500-ms step at 5 mmHg to remove inactivation. Arrow indicates the position of persistent post-stimulus MA current measurement.
(B) Quantification of peak MA current amplitude measured at −60 mV at different pressures. Data shown as mean ± SEM.
(C and D) Quantification of MA current activation threshold (C) and inactivation rate τinact (D). NS, not significant; p > 0.05, **p < 0.01; Mann-Whitney U-test (C) and unpaired t test (D). Data shown as mean ± SEM.
(E) Post-stimulus MA current amplitude at different pressures. ****p < 0.0001 for expression construct effect, two-way ANOVA. Data shown as mean ± SEM.
(F) Quantification of peak-normalized amplitude of persistent post-stimulus MA current. *p < 0.05, Welch’s test. Data shown as mean ± SEM.
See also Figure S2B.

