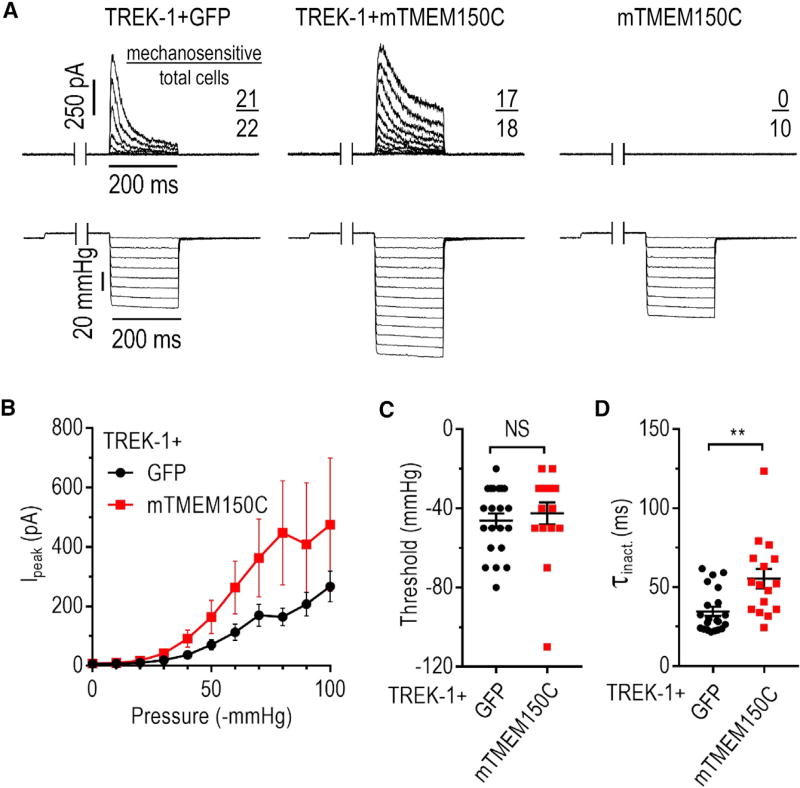
Figure 4. TMEM150C Potentiates MA Current of Potassium-Selective TREK-1 Channel.
(A) Exemplar cell-attached MA current traces recorded in HEK293TΔP1 cells in response to application of a negative pressure in the pipette using a high-speed pressure clamp (Ehold = 0 mV). Each pressure step was preceded by a 500-ms step at 5 mmHg to remove inactivation.
(B) Quantification of peak MA potassium current amplitude measured at Ehold = 0 mV at different pressures. Data shown as mean ± SEM.
(C and D) Quantification of cell-attached MA current activation threshold (C) and average inactivation rate (D). NS, not significant; p > 0.05, **p < 0.01, Mann-Whitney U test. Data shown as mean ± SEM.
See also Figures S2C and S3C.

