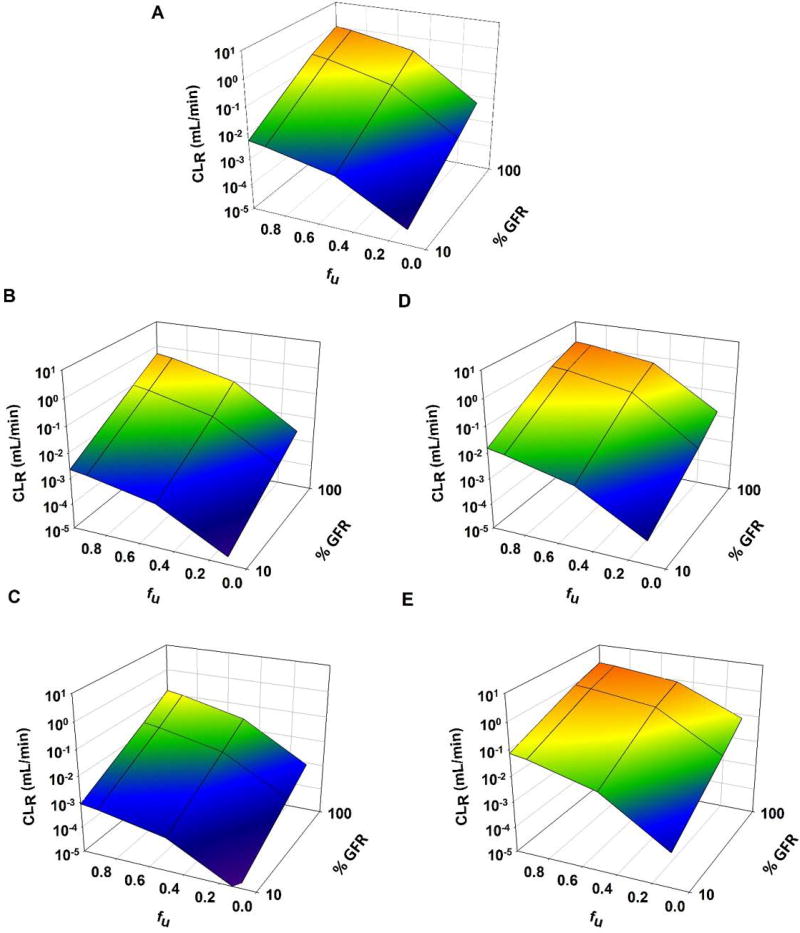
Figure 6.
3D mesh plot illustrating the effects of renal function (100%–10%) on renal clearance (CLR) of GHB (1500 mg/kg single IV bolus dose), when (1) expression of renal transporters is altered (VMAX, BBM and VMAX, BLM parameters were perturbed ± 0, 2, and 5-fold) and (2) protein binding is altered (fu = 1, 0.9, 0.5, 0.1): (A) No change in VMAX, (B) VMAX increases 2-fold, (C) VMAX increases 5-fold, (D) VMAX decreases 2-fold, and (E) VMAX decreases 5-fold

