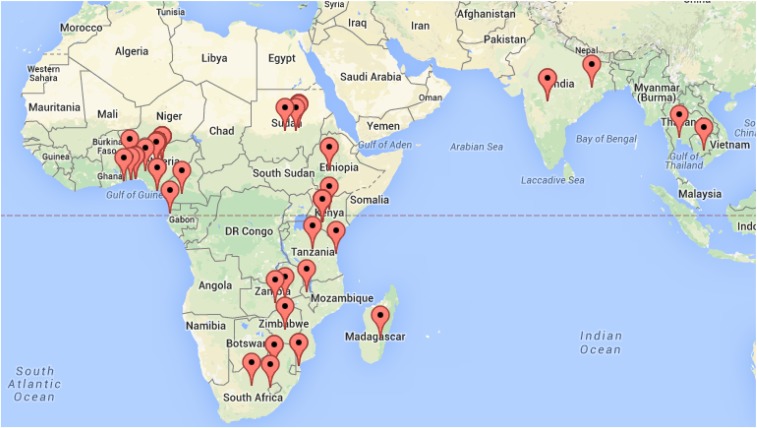
Figure 1.
Geographic distribution of survey responses. Locations were mapped primarily using user-reported city and country information, and geographic coordinates of Internet Protocol addresses in cases where location was not provided by the user. Google Maps image used here in accordance with Google’s Permissions Policy; map data from Google Maps and National Institute of Statistics and Geography, Mexico (INEGI). Locations plotted using Map Tool by Darrin Ward, with permission. This figure appears in color at www.ajtmh.org.

