Figure 1.
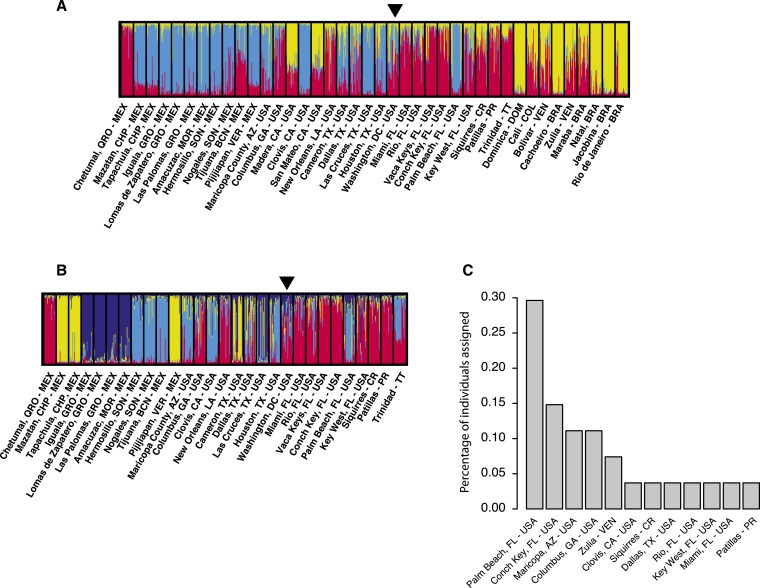
Analyses of the Aedes aegypti from Capitol Hill, Washington, DC, using 12 microsatellite markers. (A, B) STRUCTURE plots28 illustrating the genetic structure of Aedes aegypti in America. Each vertical bar represents an individual. The height of each bar is the probability of assignment to each of K genetic clusters (indicated by different colors), as determined using the Delta K method.29 K = 3 for America (A) and K = 4 for a subset of North American populations (B). An arrow at the top of the plot highlights the location of the Washington, DC, population. (C) Percentage of individuals from Washington, DC, assigned to each of the reference populations depicted in the Y-axis with the highest score. Only populations to which at least one individual was assigned are shown. Assignments were performed using Bayesian criteria for likelihood estimation with GENECLASS 2.0.37 This figure appears in color at www.ajtmh.org.

