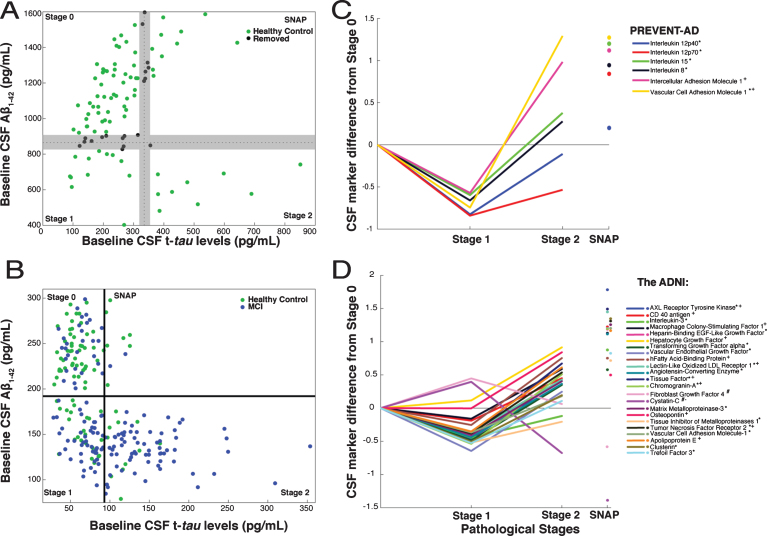
Fig.1.
CSF markers and pathological staging of Alzheimer’s disease. A) 101 healthy PREVENT-AD participants were classified as Stage 0, 1, 2, or SNAP based on Aβ1-42 (869.75 pg/mL) and t-tau (334.6 pg/mL) thresholds. Among them, to enhance contrasts, 19 (black) having CSF Aβ and t-tau levels within±5% of inter-stage thresholds were removed a priori from consideration. B) ADNI healthy-control (green) and MCI (blue) participants were similarly classified using the project’s recommended thresholds for Aβ1-42 (192 pg/mL) and t-tau (93 pg/mL). C, D) Linear models, adjusted for participants’ age, gender, APOEɛ4 carrier status and (for ADNI only) clinical diagnostic category, were used to assess CSF protein marker level differences by stage. CSF marker data were standardized using z-scores. The β coefficients for stage differences from these models are represented. In PREVENT-AD (C), six CSF markers were associated bi-directionally with pathological stage. Five were lower (*) in Stage 1 versus Stage 0, and two were greater (+) in Stage 2 versus Stage 0 (p≤0.05 uncorrected). In ADNI (D), 23 CSF markers were either increased (#) or decreased (*) at Stage 1 and at Stage 2 (+ or –) vs. Stage 0. All 23 were significantly different at Stage 2 versus Stage 1 (pFDR ≤ 0.05).

