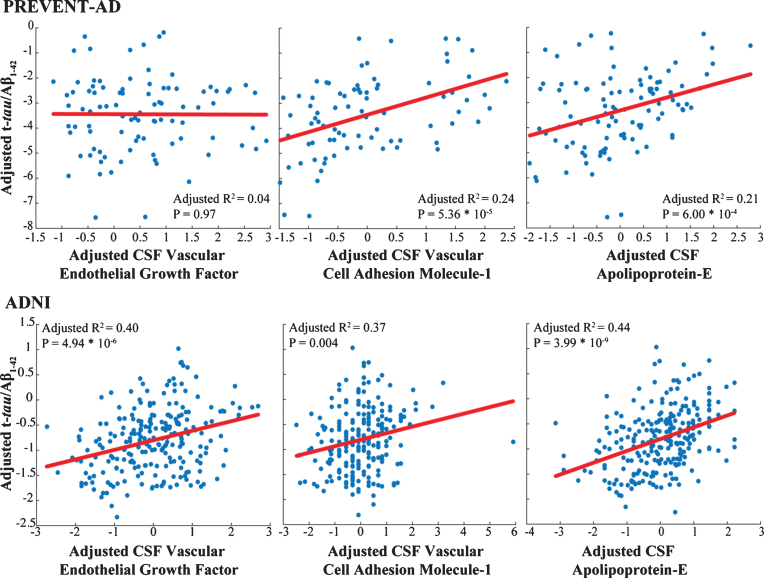
Fig.3.
Markers common to both cohorts show similar association with AD pathology. Adjusted response plots show the association of apolipoprotein E level, VEGF and VCAM-1 with t-tau/Aβ1-42 ratio. R2 values are given for the fully adjusted model, and p-values are reported for the given CSF marker in this model.

