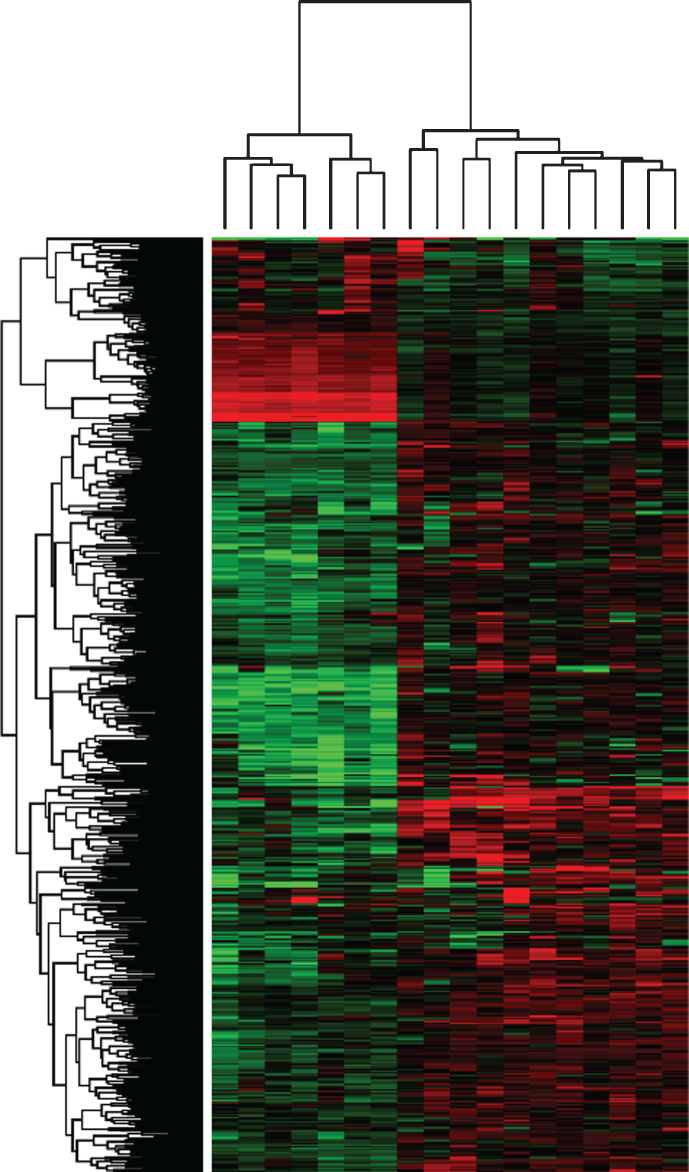
Fig.1.
Clustering of differentially expressed basal and luminal genes. Gene expression profiling was performed (Canine Genome Array 2.0 Affymetrix, Santa Clara, CA). Microarray data were analyzed for canine normal bladder tissues (n = 4) and compared to canine InvUC (n = 18) using GeneSpring GX 13.1.1 (Agilent Technologies, Santa Clara, CA) and recently updated annotations by Affymetrix. Differentially expressed genes (t-test, p corr 0.05, 2FC) were selected and clustered according to basal and luminal patterns reported in human InvUC [6]. Genes clustered in two distinct groups with seven tumor samples segregating as basal (left cluster), and 11 tumor samples as luminal (right cluster).

