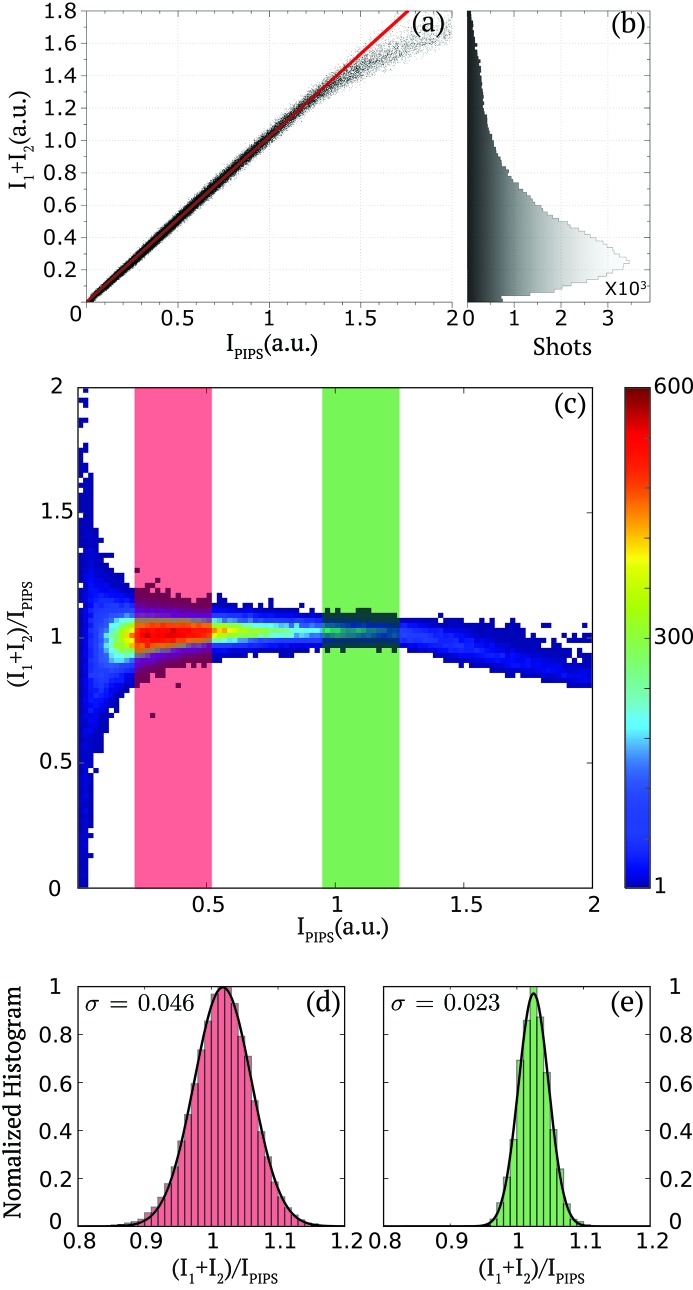
Figure 2.
(a) Pulse intensity correlation between the fast diode measurement of the summed-pulse intensities in each pulse ( ) and the PIPS diode signal
  for a time separation
  = 8.75 ns. (b) Histogram of the summed-pulse intensities (
 ) distribution measured by the fast diode from 105 shots. (c) Two-dimensional cumulative histogram of the pulse intensity ratio of fast diode summed-pulse intensity and PIPS diode
  as a function of the PIPS diode signal
  from 105 shots. The color bar indicates counts. (d, e) Histograms and Gaussian fits (solid line) of the PIPS normalized pulse intensity of the pulse pairs
  for the two signal levels of
  indicated by the red and green areas in (c).

