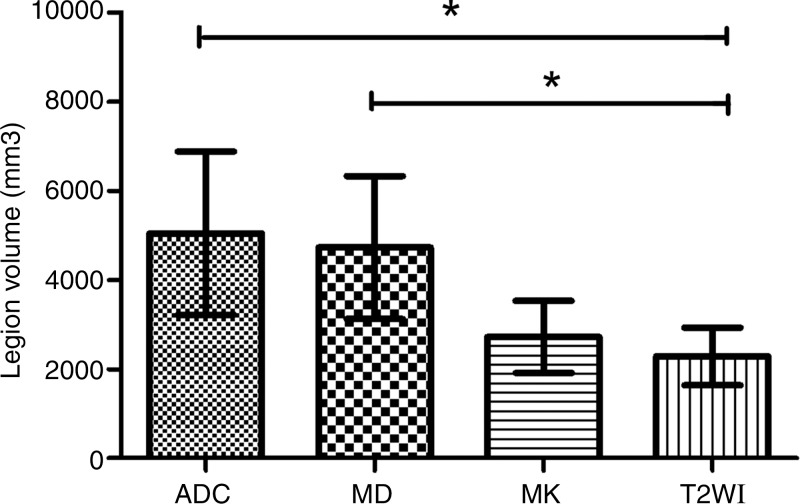
Figure 3:
Graph shows comparison of the infarction lesion volume on ADC, MD, MK maps to the final T2-weighted image. The lesion volume on MK map was most similar to the final infarct size. * = P < .05, ADC = apparent diffusion coefficient, MD = mean diffusivity, MK = mean kurtosis, T2WI = T2-weighted image.

