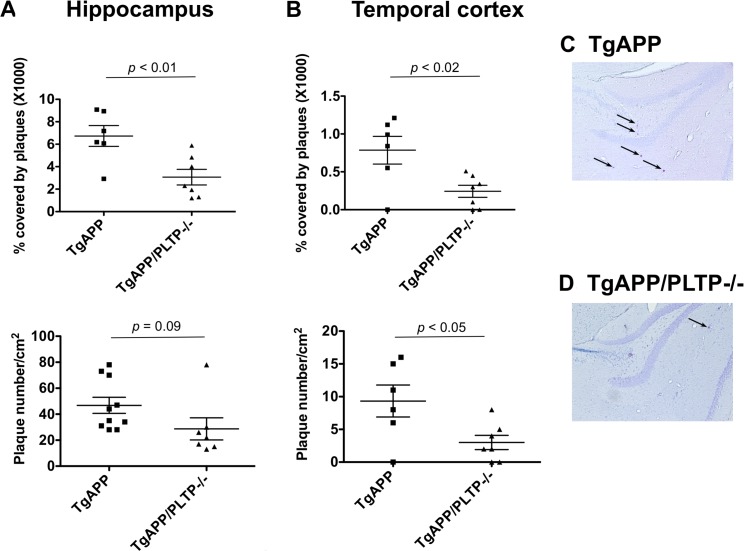
Figure 2. Quantification of Congo-Red positive plaques in TgAPP and TgAPP/PLTP–/– mice.
Brain sections from 6 months old TgAPP mice (n = 10) and TgAPP/PLTP–/– mice (n = 7) were stained with Congo Red and images were captured using an optical microscope. Panels (A–D) Amyloid plaques counts and surfaces were determined and normalized to the total surface of the hippocampus or temporal cortex. Results are presented as mean+SEM. Statistical differences were assessed using the Student’s t test. Panels (C–D) Representative pictures showing Congo-Red positive plaques (black arrows) in the hippocampus of TgAPP and TgAPP/PLTP–/– mice. Scale bar, 500 μm.

