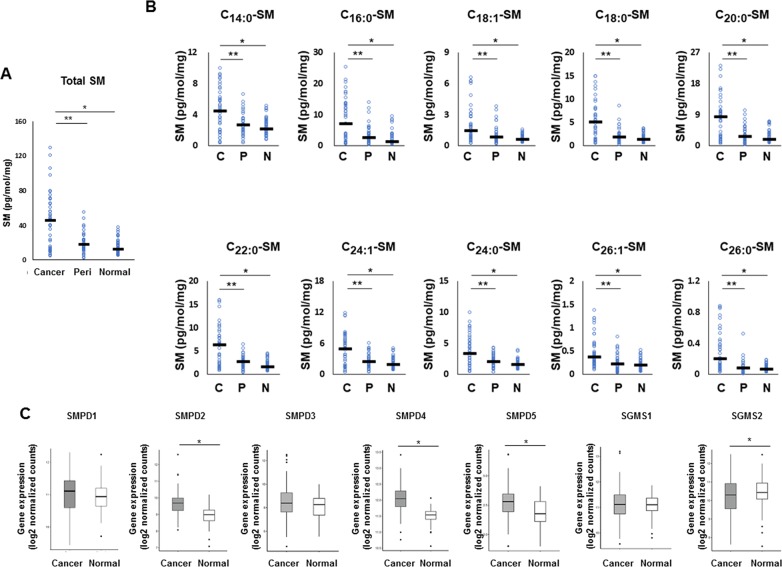
Figure 4. The metabolism in the sphingomyelin pathway for ceramide synthesis in breast cancer patients.
(A, B) Levels of total sphingomyelin (SM) (A) and each sphingomyelin species (C14:0, C16:0, C18:1, C18:0, C20:0, C22:0, C24:1, C24:0, C26:1 and C26:0) (B) in cancer tissue (Cancer or C), peri-tumor tissue (Peri or P) and normal tissue (Normal or N) were determined by mass spectrometry. Mean values are shown by the horizontal lines. *, P<0.05 for cancer vs. normal tissue; **, P<0.05 for cancer vs. peri-tumor tissue. (C) The expression of sphingomyelin phosphodiesterase 2 (SMPD2), sphingomyelin phosphodiesterase 4 (SMPD4), sphingomyelin phosphodiesterase 5 (SMPD5) and sphingomyelin synthase 2 (SGMS2) in The Cancer Genome Atlas (TCGA) cohort (n=112) were analyzed. Mean values are shown by the horizontal lines. *, P<0.05 for cancer vs. normal tissue.

