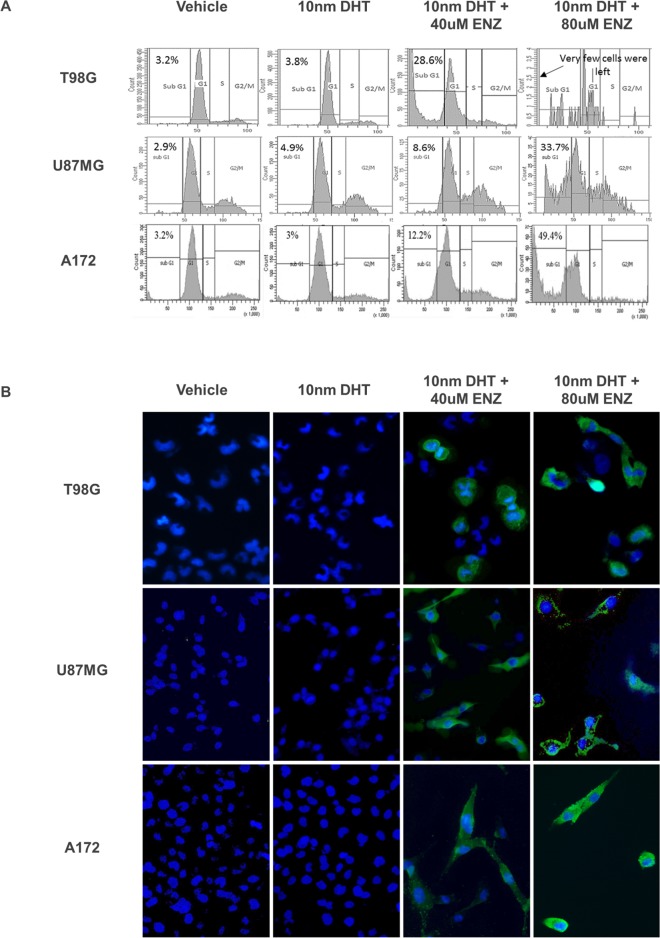
Figure 4. Analysis of PI labeling and cleaved caspase 3 in the A172 U87MG and T98G cell lines after enzalutamide treatment.
Glioma cell lines were treated with vehicle (0.15% ethanol), 10nm DHT with or without 40 or 80μM enzalutamide, as indicated and subjected to PI labeling (A) or to cleaved caspase 3 immunofluorescence (B). (A) DNA content histogram following cell cycle analysis with propidium iodide (PI). PI fluorescence intensity was captured with flow cytometry via the FL2 channel and 488nM laser excitation. The percentage of cells at sub-G1 is indicated for each treatment. Enzalutamide sensitive cell lines A172 and U87 were analyzed after 48 hrs, T98G - after 72 hrs. (B) 72 hrs after treatment with enzalutamide the cells were fixed and incubated with primary antibody for Cleaved Caspase-3 (Asp175) and Alexa Fluor 488 conjugate secondary antibody (green). Before visualization the cell nuclei were stained with DAPI (blue). The cells were captured with a EVOS® Digital Microscope at x 200 magnification.

