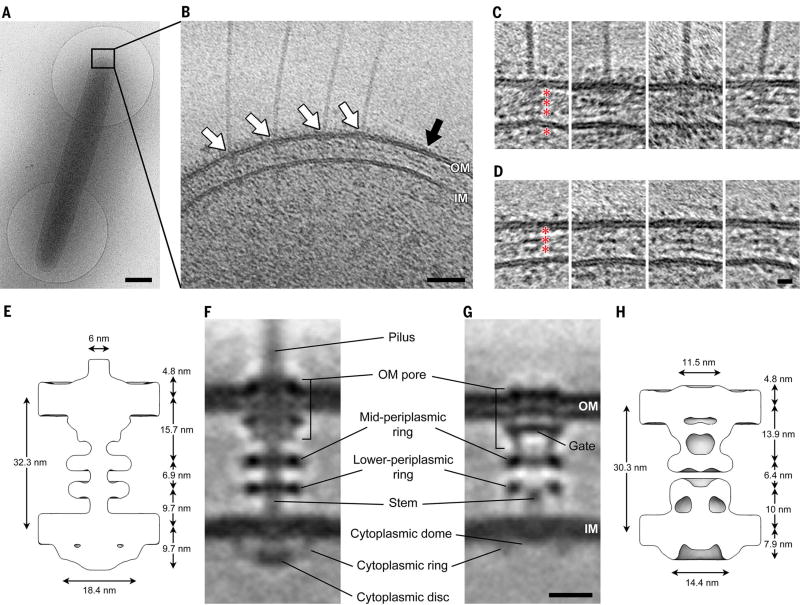
Fig. 1. Visualizing the T4PM in intact M. xanthus cells.
(A) A frozen-hydrated M. xanthus cell on an EM grid. (B) Slice through tomogram of the cell pole. White arrows, piliated T4PM basal bodies; black arrow, an empty T4PM basal body. Outer and inner membranes (OM and IM) are indicated. (C and D) Examples of slices through subtomograms containing piliated and empty T4PM basal body structures, respectively. Red asterisks denote periplasmic and cytoplasmic density layers. (E and H) Schematic envelopes of the subtomogram averages of wild-type piliated (E) and ΔpilB empty (H) T4PM basal bodies, showing their molecular dimensions. (F and G) Slices through subtomogram averages of wild-type piliated (F) and ΔpilB empty (G) T4PM basal bodies, with annotations of structural features. Scale bars, 500 nm (A), 50 nm (B), 5 nm [(C) and (D)], 10 nm [(F) and (G)].

