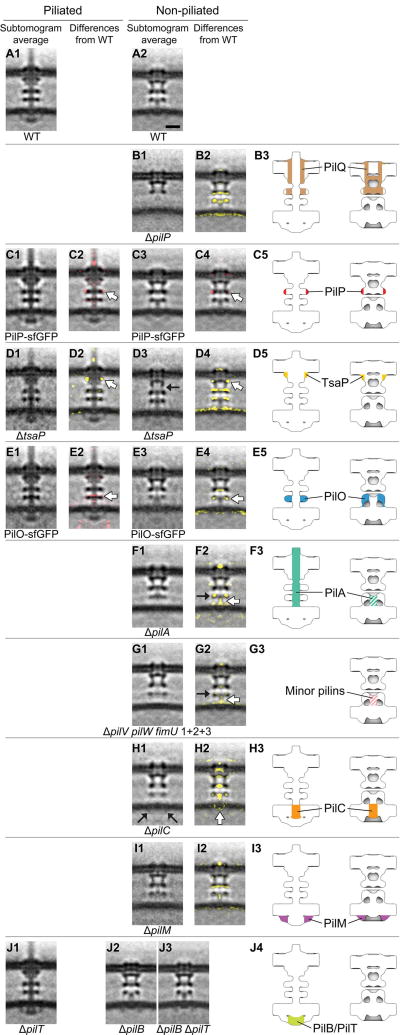
Fig. 2. Mapping T4PM components.
First and third columns: Central slices of subtomogram averages of piliated and empty T4PM basal bodies, respectively, from different M. xanthus strains. Second and fourth columns: Differences in the T4PM mutant structures versus the wild type (red and yellow colors respectively denote addition and omission of densities, with opacities of 10%, 20%, 30%, 40%, and 50% corresponding to density differences of 1, 1.5, 2, 2.5, and 3 standard deviations, respectively, overlaid on the wild-type subtomogram averages). White arrows indicate the component locations identified by the difference maps. Fifth column: Schematic representations of piliated (left) and empty (right) T4PM basal bodies showing each identified component location. Scale bar in A2, 10 nm (applies to columns 1 through 4).

