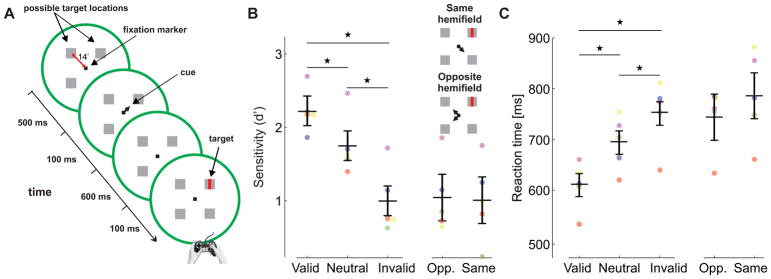
Figure 3. Attention and fine spatial discrimination (Exp. 3).
(A) Observers reported whether a tiny bar, which could appear in one of four boxes 14′ away from the fixation marker, was tilted vertically or horizontally. The target was preceded by a central cue that indicated its most likely location (76% cue validity). (B-C) Experimental results, measured as (B) accuracy (d′), and (C) reaction times for different trial types across observers (n=5). Differences between valid and invalid trials were statistically significant for all individual (Sensitivity, two-tailed z-tests: S1: p=1.9 10−7; S2: p=0.01; S3: p=4.9 10−4; S4: p=0.019; S5: p=2.9 10−12. Reaction times, two-tailed Wilcoxon rank sum tests: S1: p=1.6 10−9; S2: p=6.4 10−16; S3: p=2.1 10−10; S4: p=1.7 10−11; S5: p=8 10−24). Accuracy and reaction times are also shown separately for the invalid trials in which the cue and the target were presented in the same and opposite hemifield, respectively. Error bars are 95% CI. Asterisks indicate statistically significant differences (Tukey HSD post-hoc tests. Sensitivity: valid trials vs. neutral trials, p=0.0123; valid vs. invalid, p=0.00004; neutral vs. invalid, p=0.0008. Reaction times: valid vs. neutral, p=0.0009; valid vs. invalid, p=0.00004; neutral vs. invalid p=0.0084). Conventions are as in Fig. 1.

