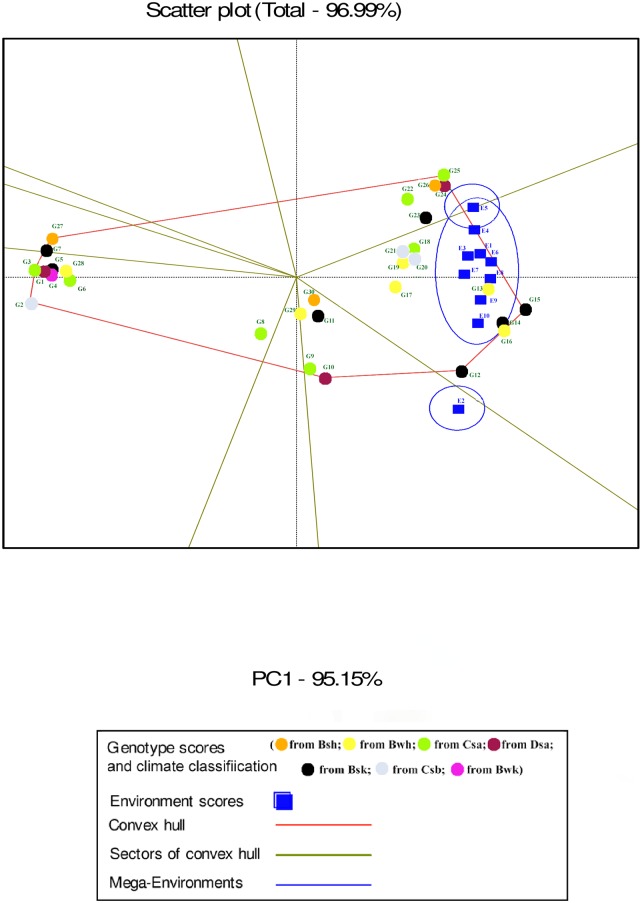
Fig 9. The which-won-where polygon view of the GGE biplot for mucilage content of 30 Plantago genotypes (P. major, G1- G7; P. officinalis, G8-G10; P. amplexicaulis, G11; P. ovata, G12-G16; P. psyllium, G17-G21; P. lanceolata, G22-G26; P. coronopus, G27- G28; P. lagopus, G29- G30) under 10 environments (E) to show which genotypes performed best in which environment and meaningful mega environment.
The perpendicular of the polygon facilitates the visualize comparison of distance between genotypes and environments. Different mega environments located in different biplot sectors. Köppen-Geiger climate classification [45] letter: B: arid, s: summer dry, k: cold arid.

