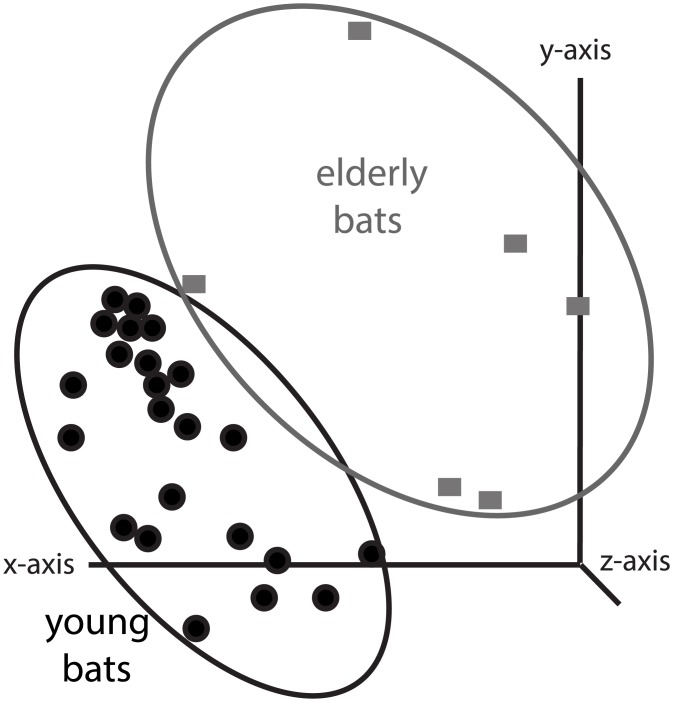
Fig 2. Principle component analysis (PCA) of metabolic profile of fecal samples show separate groupings for age groups.
The young age group is demonstrated by open squares (one-year-old animals) and, filled, black squares (two-year-old animals). The elderly age group is demonstrated by open circles (fourteen-year old animals) and filled, black circles (fifteen-year-old animals). Variation was explained on three axes: x-axis (18.82%), y-axis (7.98%), and z-axis (5.69%).

