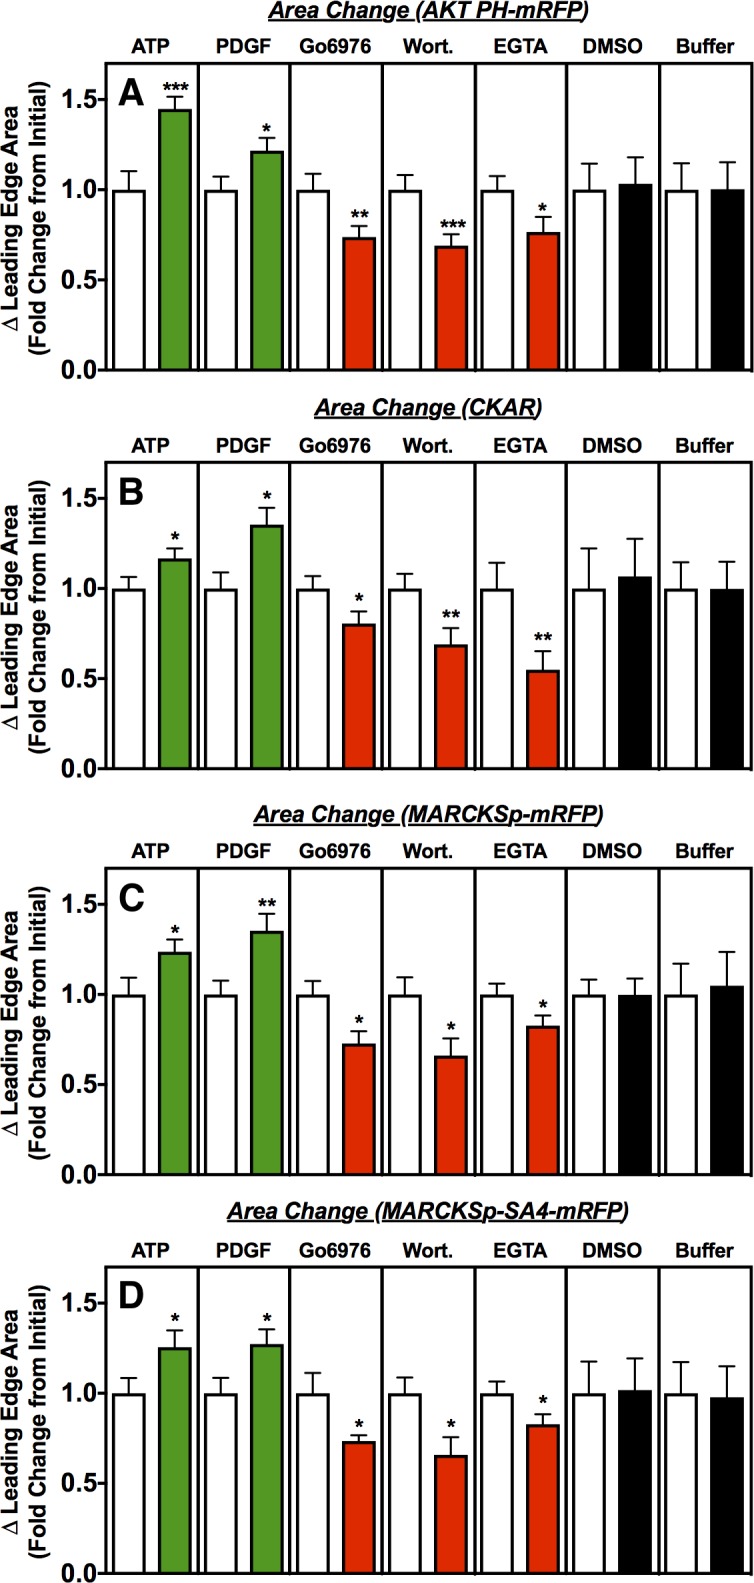
Fig 3. Steady-state changes in leading edge area following modulator addition.

Polarized, actively ruffling RAW macrophages expressing the indicated activity sensor were imaged at specific times following addition of the indicated modulators (green = activator, red = inhibitor, black = carrier medium control). Open bars represent the initial leading edge area, normalized to 1.0, immediately after modulator addition. Filled bars represent the fold change as the leading edge area approaches a new steady state size approximately 5 min after modulator addition (t = 4.5 to 5.5 min (see Methods)). As expected for functional leading edge signaling in all sensor backgrounds, activators trigger significant leading edge expansion, inhibitors trigger significant leading edge contraction, and controls have no significant effect. Error bars represent standard errors of the mean for 15–35 cells measured in at least 4 independent experiments. Asterisks indicate significance of each change from the initial area at t = 0 (one, two or three asterisks indicate p < 0.05, p < 0.01, or p < 0.001, respectively). Image analysis described in Fig 2A and Methods.
