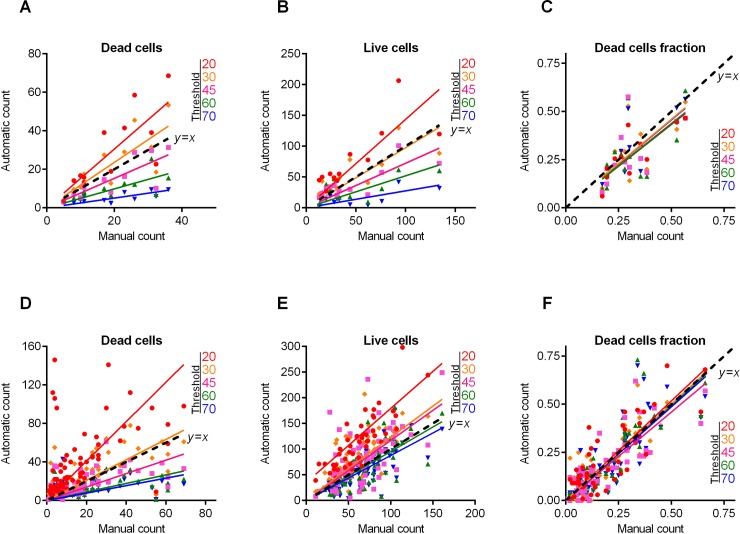
Fig 7. Caco-2 cells count and live/dead ratio dependence on the image analysis threshold T.
Full lines show the linear regression lines, while dashed line shows the ideal counting line as determined by the manual analysis performed by several experts in visual microscopic image analysis. Panels A-C show data for the 12 images presented in Fig 6. Panels D-F show data for the 87 microscopic images taken randomly from different experiments with various imaging conditions.

