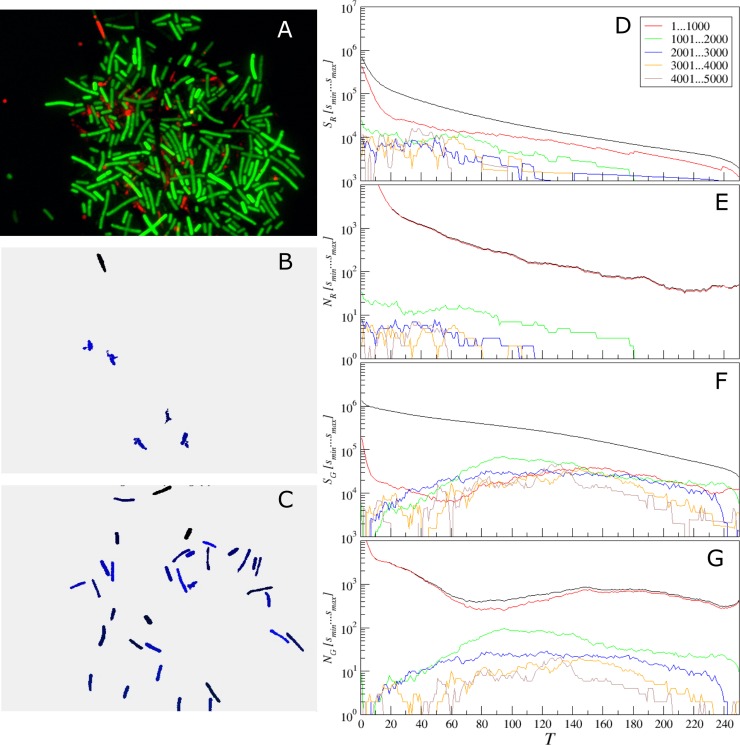
Fig 12. Adjustment of the threshold and single cell size balance for B. subtilis.
(A)—the raw image, (B) and (C)–isolated objects belonging to a given size range between 1001 and 2000 pixels, exemplified for the red (with T = 70) and the green (with T = 100) color channels, respectively. (D, F) the black curve gives the total area above the threshold T, which is the sum of the lower (colored) curves that represent the total area of isolated objects within a given size range for the red (D) or the green channel (F). (E, G) the black curve gives the total count of objects that appear isolated after threshold-based filtering for any given threshold value T, which is the sum of the lower (colored) curves that represent the total count of isolated objects within a given size range for the red (D) or the green channel (F).

