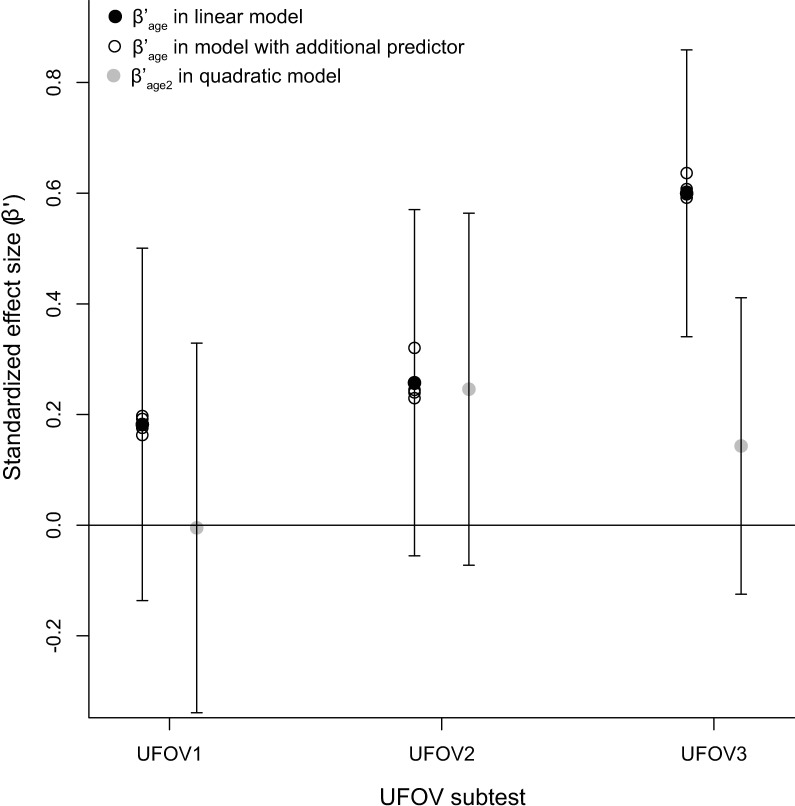
Fig 4. Estimated standardized effect sizes (β’) of agec and agec2.
The black and grey filled circles and their 95% confidence intervals represent the standardized estimates of the effects of agec and agec2 in the linear and quadratic regression models, respectively. The open circles represent the standardized estimates of agec in the quadratic model and in models with additional elementary visual function predictors, i.e., near and far visual acuity measured with ETDRS charts measured at 4 m and 40 cm respectively, crowding intensity measured with LEA charts at 40 cm and contrast sensitivity represented by the Weber contrast threshold measured with a custom psychophysical task where subjects indicate which of the two figures (car or truck similar to UFOV stimuli) is currently presented. β’ = estimated standardized effect size, UFOV = Useful Field of View.

