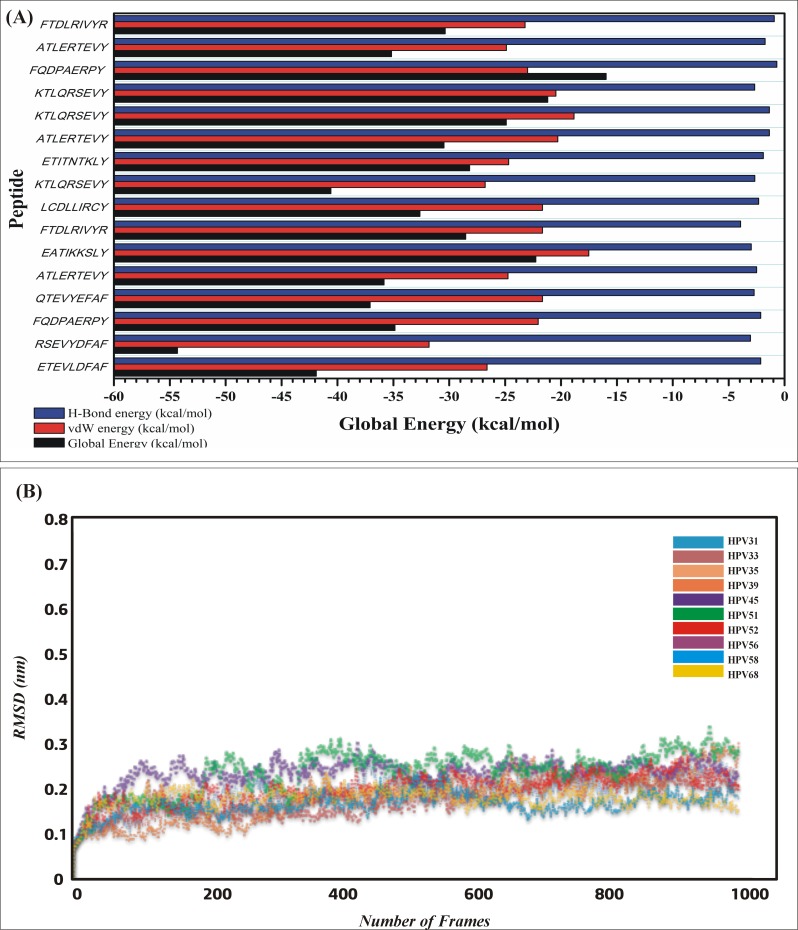
Fig 6.
(A) The binding affinities (Global energies, vdW, electrostatic interactions) of all the docked epitopes are given in the graph. (B) Plot of RMSD of the backbone structures of MHCI-peptides complexes after 20ns simulation. The RMSD graph of each complex is shown in different colors. The graph (along x-axis is number of residues, y-axis RMSD in nm) is showing the stable movement of all the complexes.

