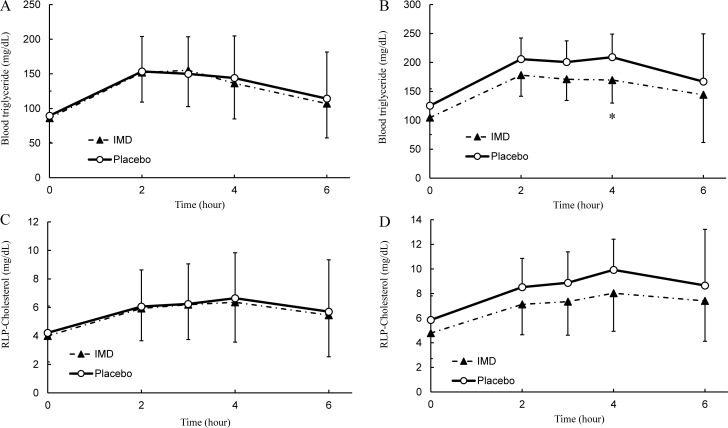
Fig 4. Fat-loading study in human.
(A) Postprandial transition in human blood triglyceride levels (n = 40). (B) Subgroup analysis in blood triglyceride levels (n = 14). (C) Postprandial transition in human blood remnant-like particle cholesterol levels (n = 40). (D) Subgroup analysis in blood remnant-like particle cholesterol levels (n = 14). ○: Placebo, ▲: IMD. Values are mean ± standard deviation. Statistical analyses were performed using a Wilcoxon signed-rank test (*p <0.05).

