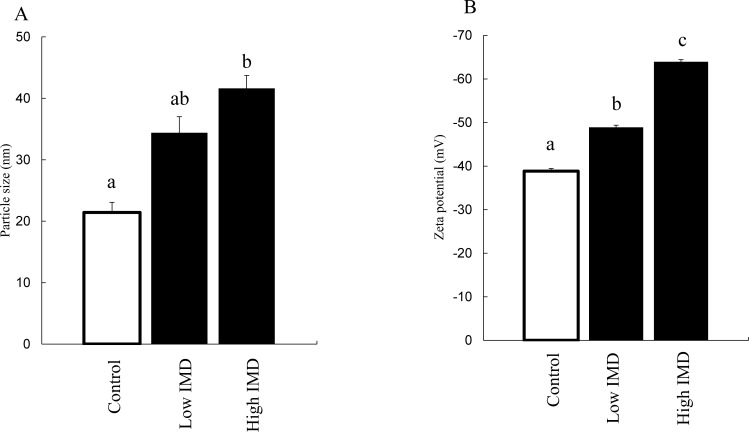
Fig 8. Physical properties of micelles.
(A) Changes in particle size after adding IMD. (B) Changes in zeta potential after adding IMD. Control: 150 mM phosphate buffer; particle size (n = 3); zeta potential (n = 5). Low IMD: 0.1 g/mL IMD in 150 mM phosphate buffer; particle size (n = 3); zeta potential (n = 4). High IMD: 0.2 g/mL IMD in 150mM phosphate buffer; particle size (n = 3); zeta potential (n = 5). Values are mean ± standard error. Statistical analyses were performed using Tukey-Kramer multiple comparison tests. Different letters indicate significant differences: p <0.05.

