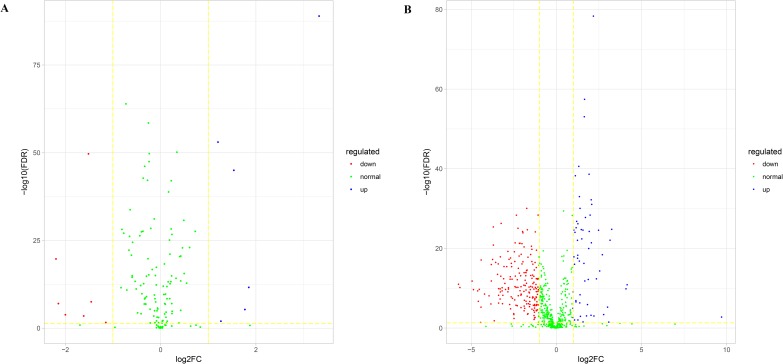
Fig 6. Volcano plots of potential miRNA and lncRNA edge biomarkers.
(A) Volcano plot of potential miRNA edge biomarkers. (B) Volcano plot of potential lncRNA edge biomarkers. Green nodes represent RNAs that are not differentially expressed, red nodes represent RNAs that are downregulated, and blue nodes represent RNAs that are upregulated.

