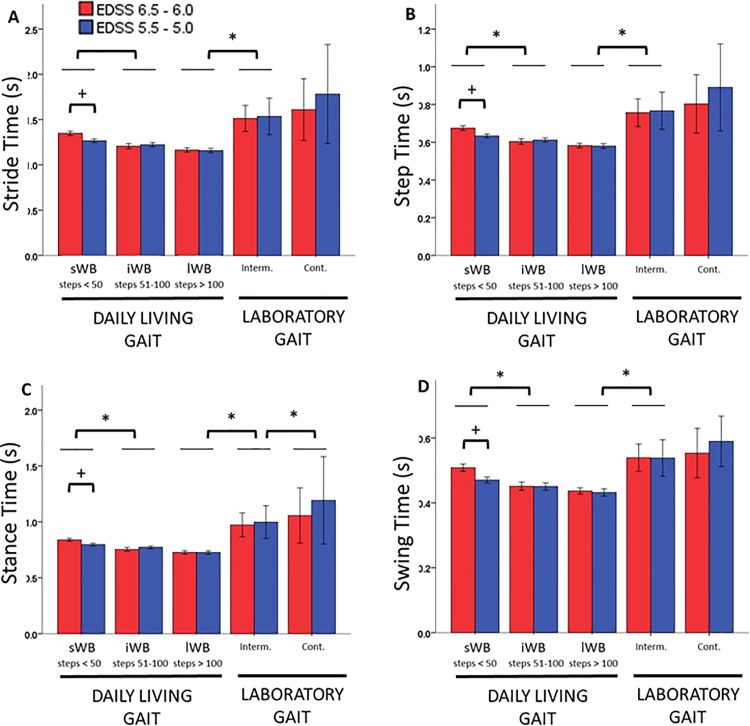
Fig 2. Temporal parameters.
The figure depicts the average values of stride time (A), step time (B), stance time (C) and swing time (D) for the disability groups with EDSS 6.5–6.0 (red) and EDSS 5.5–5.0 (blue) for the daily life walking bouts (sWB, iWB and lWB) and the laboratory gait (intermittent and continuous). Values are mean and 95% CI. * Significant difference between WB types, p < 0.05. + Significant difference between disability groups, p<0.05.

