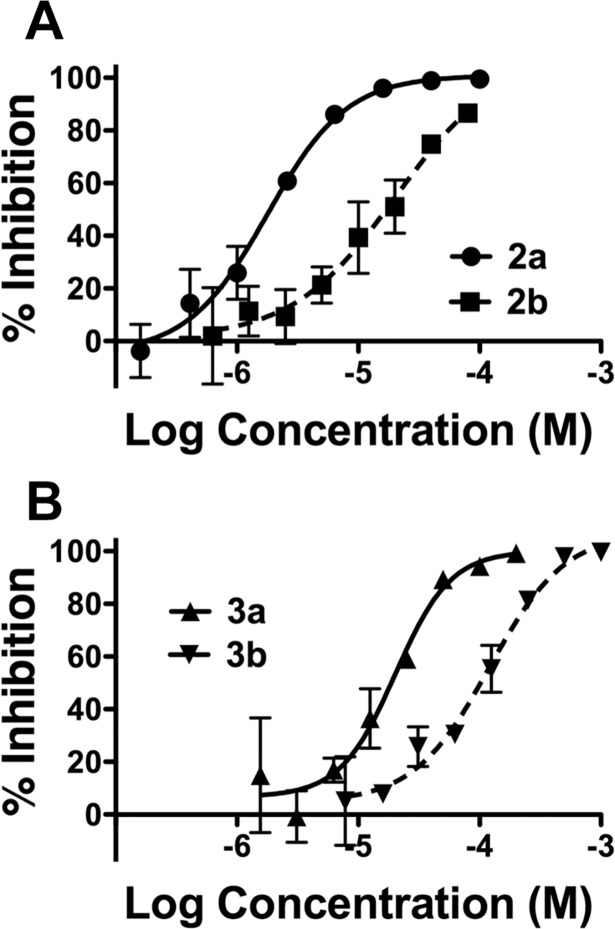
Fig 3. Dose-response curves for nucleosides and nucleobases.
The percent (%) inhibition of each compound over the log10 of concentrations compared to DMSO alone is shown. Doses were performed in triplicate and repeated at least twice. Average values plus standard deviation for each dose for one representative experiment are shown. Error bars in A and B may be too small to be seen.

