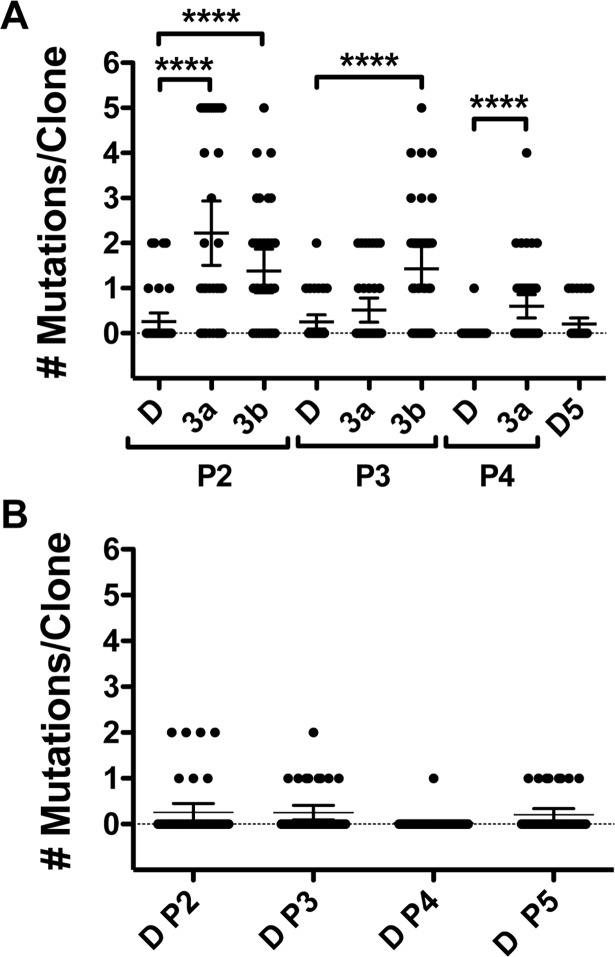
Fig 5. The number of mutations per sequence clone.
A. Virus was passaged in cells treated with compounds indicated. The prM/E region from viral RNA was amplified using RT-PCR, ligated into a vector and approximately 35–50 independent clones were chosen for each drug treatment at indicated passage. The nucleotide sequence of the DENV region was determined using standard Sanger sequencing methods for each clone. Thin black horizontal bar indicates the mean number of mutations per clone and the vertical bars indicate the 95% confidence intervals. Four asterisks signify p < 0.0001. P values determined using a two-tailed Mann-Whitney U test. B. The DMSO passage data from A graphed separately. P = passage and D = DMSO.

