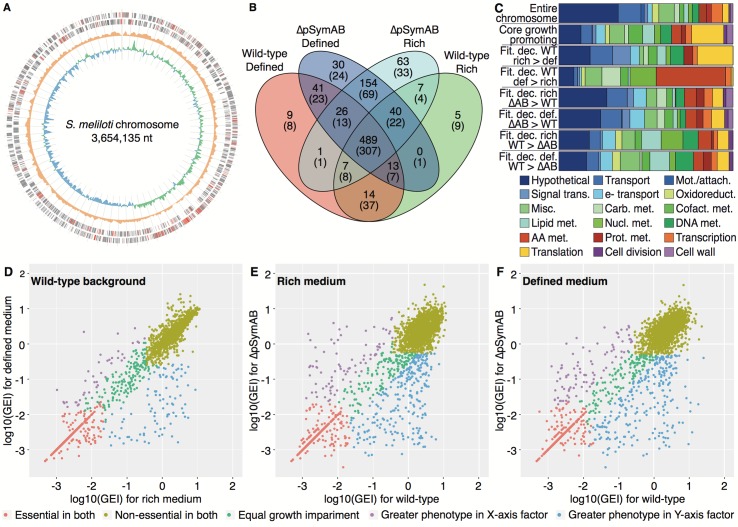
Fig 2. Characteristics of the core genetic components of S. meliloti.
(A) A circular plot of the S. meliloti chromosome is shown. From the outside to inside: positive strand coding regions, negative strand coding regions (for both positive and negative strands, red indicates the position of the core 489 growth promoting genes), total insertion density, and GC skew. The insertion density displays the total transposon insertions across all experiments over a 10,000-bp window. The GC skew was calculated over a 10,000-bp window, with green showing a positive skew and blue showing a negative skew. Tick marks are every 50,000 bp. (B) A comparison of the overlap between the growth promoting genome (Group I and II genes, shown first) and the essential genome (Group I genes, values in parentheses) of each Tn-seq dataset. Each dataset is labeled with the strain (wild-type or ΔpSymAB) and the growth medium (defined medium or rich medium). (C) Functional enrichment plots for the indicated gene sets. Name abbreviations: Fit–fitness; Dec–decrease; WT–wild-type; ΔAB—ΔpSymAB; Def–defined medium; Rich–rich medium. For example, ‘Fit. dec. WT def > rich' means the genes with a greater fitness decrease in wild-type grown in defined medium compared to rich medium. Legend abbreviations: AA–amino acid; Attach–attachment; Carb–carbohydrate; Cofact–cofactor; e-–electron; Met–metabolism; Misc–miscellaneous; Mot–motility; Nucl–nucleotide; Oxidoreduct–oxidoreductase activity; Prot–protein; Trans–transduction. (D-F) Scatter plots comparing the fitness phenotypes, shown as the log10 of the GEI scores (Gene Essentiality Index scores; i.e., number of insertions within the gene divided by gene length in nucleotides) of (D) wild-type grown in rich medium versus wild-type grown in defined medium, (E) wild-type grown in rich medium versus ΔpSymAB grown in rich medium, and (F) wild-type grown in defined medium versus ΔpSymAB grown in defined medium.

