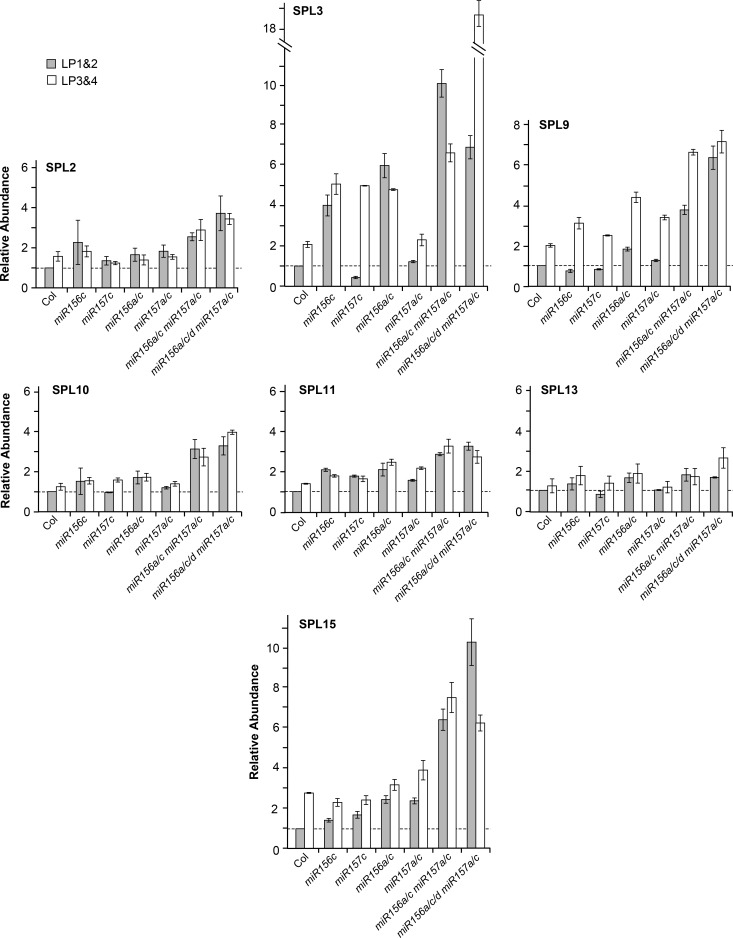
Fig 7. RT-qPCR analysis of SPL transcript levels in 1 mm leaf primordia of Col and mir156/mir157 mutants grown in SD.
Most transcripts increase less than 2-fold between LP1&2 and LP3&4 in Col, and increase 2-fold or less in miR156 and miR157 mutants. Results are relative to the value for Col LP1&2. Error bars represent the SD for 3 biological replicates.

