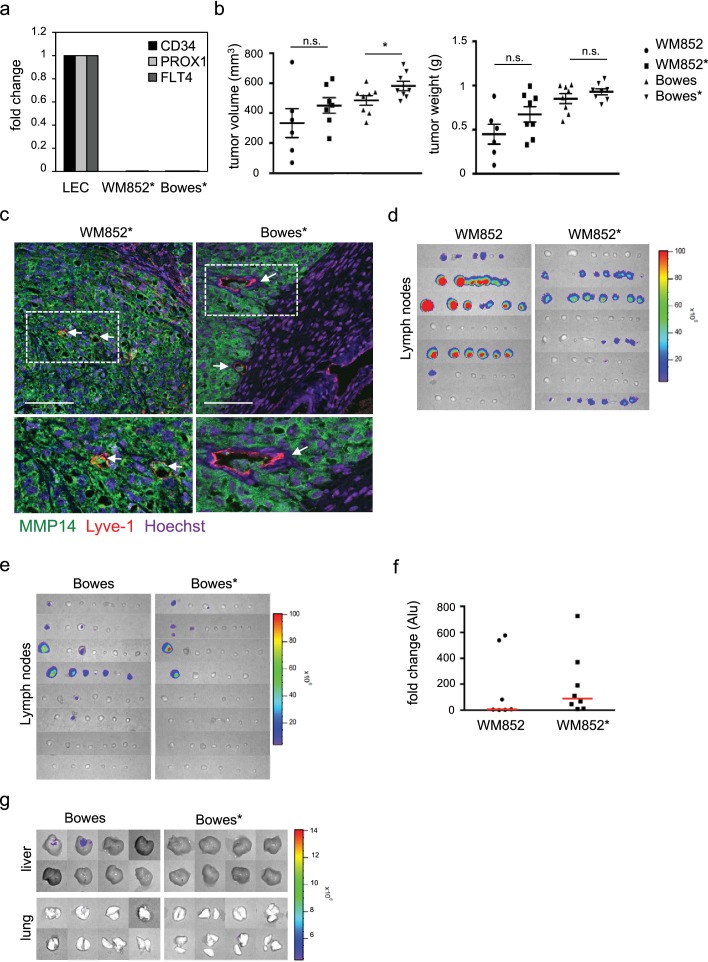
Figure 1. Co-culture of melanoma cells and LECs reveals melanoma invasion into the LEC 3D structures and increases the metastatic potential of WM852 cells in vivo.
(a) Schematic of the experimental pipeline. (b) Confocal images of LEC spheroids (PECAM-1, red) in 3D fibrin matrix (left panel), LEC spheroids co-cultured with WM852 (green, middle panel) or Bowes (green, left panel). The area enclosed in the white square is shown enlarged below each panel. Melanoma cells were stained with GFP (green), and nuclei were counterstained with Hoechst 33342. Maximum intensity Z-projections of confocal stacks are shown. (c,d) Growth rates of the 3D LEC primed WM852* (c) and Bowes* (d) derived tumors (n = 8 for both cell types) compared to control WM852 (n = 7) and Bowes (n = 8) tumors, respectively. (e, f) Distant organ metastasis, detected by bioluminescence imaging of luciferase signal, in liver (e) and lung (f) of SCID mice subcutaneously injected with WM852 alone or co-cultured with LECs (WM852*). Upper panels: representative images of the indicated organs, each box represents an organ from one mouse. Bottom panel: quantification of luciferase signal, each dot represents the luciferase value in one sample. Horizontal line indicates the average, vertical bars represent SEM. *: p<0.05. n.s., non-significant.


