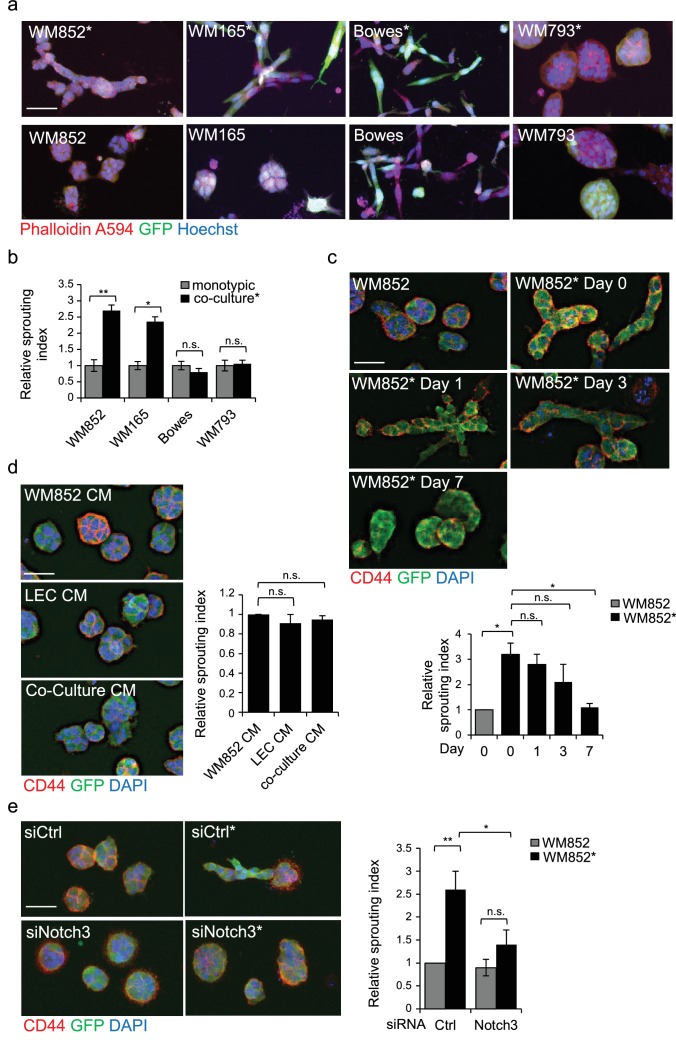
Figure 3. LEC interaction modifies the 3D growth phenotype of the melanoma cells.
(a) Representative confocal images of 3D fibrin assays after magnetic separation of the indicated melanoma cell lines co-cultured with LEC (*, upper panels) or from monotypic culture (bottom panels). GFP expressing (green) melanoma cells were stained with Phalloidin A594 (red), nuclei are counterstained with Hoechst 33342 (blue). Maximum intensity Z-projections of the confocal stacks are shown. Scale bar = 50 µm. (b) Quantification of the sprouting index for the samples in (a). Graphs show the average of at least three images per condition per two independent experiments, error bars indicate the SEM p<0.05; **; p<0.01; n.s., non-significant. (c) Representative images of the 3D fibrin assay of WM852 and WM852* after magnetic separation at the indicated day after separation. The graph represents the average of three images per condition analysed in each of the two independent experiments. Error bars represent SEM. *: p<0.05; n.s., non-significant. (d) Representative images of the 3D fibrin assay of monotypic WM852 treated with conditioned media (CM) from the indicated sources. The graph represents the average of three images per condition. Error bars represent SEM. n.s., non-significant. (e) Representative images of the 3D fibrin assay of WM852 and WM852* treated with the indicated siRNAs for 72 hr prior to magnetic separation and fibrin embedding. The graph represents the average of three images per condition per three independent experiments. Error bars represent SEM. *: p<0.05; **; p<0.01; n.s., non-significant.


