Figure 2.

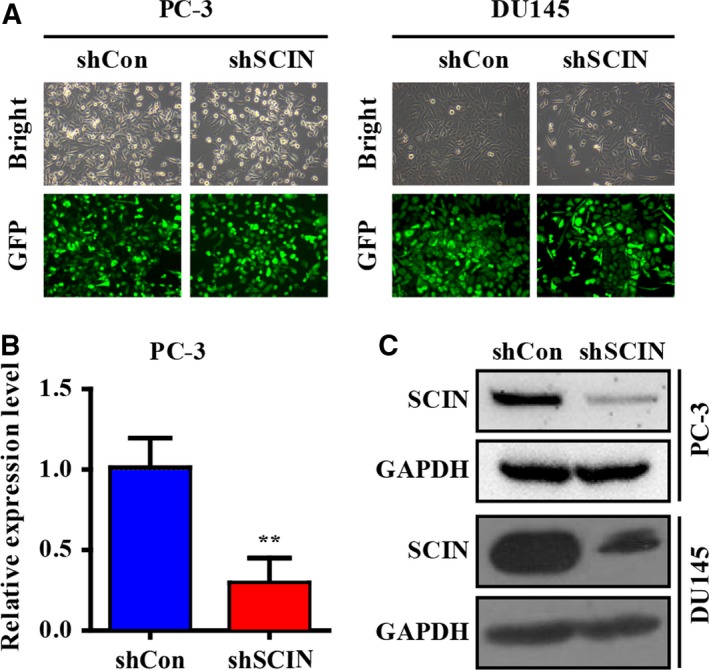
Efficiency of SCIN knockdown. (A) Representative graphs of bright and GFP fluorescence fields in shCon and shSCIN groups. (B,C) mRNA and protein levels of SCIN in shCon and shSCIN groups.

Efficiency of SCIN knockdown. (A) Representative graphs of bright and GFP fluorescence fields in shCon and shSCIN groups. (B,C) mRNA and protein levels of SCIN in shCon and shSCIN groups.