
Figure 4.
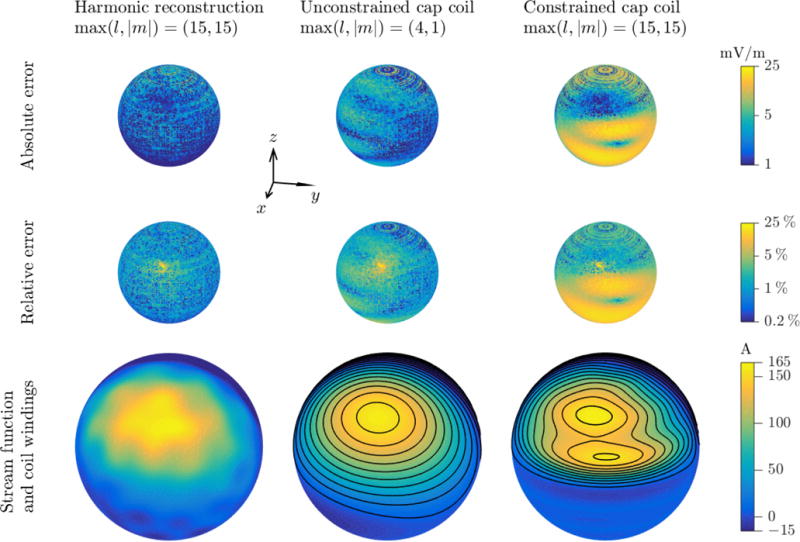
LFMS cap coil designs. From left to right: spherical harmonics representation of the standard LFMS coil simulation, unconstrained cap coil design, and constrained cap coil design. Top and middle rows: distributions of E-field absolute and relative errors compared to the simulation on the cortical surface of the spherical model. Bottom row: stream function and coil windings for the two coil designs. Color scale for each row is shown to the right; note logarithmic scale in top and middle rows, and asymmetric scale in bottom row, covering only the range of stream function values on the shown right hemisphere.