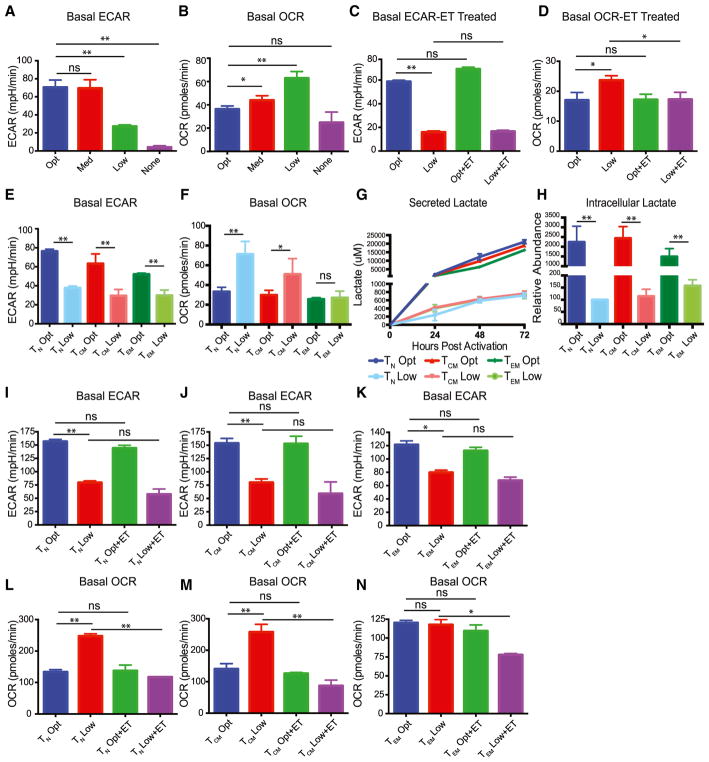
Figure 3. Effector Memory T Cells Are Unable to Augment Oxidative Phosphorylation in Low Glucose.
(A and B) Total CD4 T cells were activated with anti-CD3/CD28 coated beads in optimal (35 mM), medium (3.5 mM), low (0.35 mM), or no glucose (0 mM) for 48 hr, and basal extracellular acidification rate (ECAR) (A) and basal oxygen consumption rate (OCR) (B) were measured by XF Seahorse Analyzer.
(C and D) Total CD4 T cells were activated with anti-CD3/CD28-coated beads in optimal and low glucose and pre-treated in the presence of etomoxir (ET) or vehicle (DMSO) for 48 hr before basal OCR (D) and ECAR (C) was measured by XF Seahorse Analyzer.
(E and F) Basal OCR (E) and basal ECAR (F) of indicated T cell subsets were quantified.
(G) Lactate was measured in the media of indicated T cell subsets after 24, 48, or 72 hr of culture using high-performance liquid chromatography (HPLC).
(H) Relative intracellular abundances of lactate from sorted activated T cell subsets at 48 hr by LC-MS, normalized by cell number and cell volume.
(I–N) Basal OCR rates of TN (I), TCM (J), and TEM (K) and basal ECAR rates of TN (L), TCM (M), and TEM (N) were quantified.
Error bars reflect SEM. All data are representative of 4 independent experiments and donors. *p < 0.05, **p < 0.01, paired two-tailed Student’s t test or in case of multiple comparisons, one-way ANOVA followed by Tukey LSD; ns, not significant.

