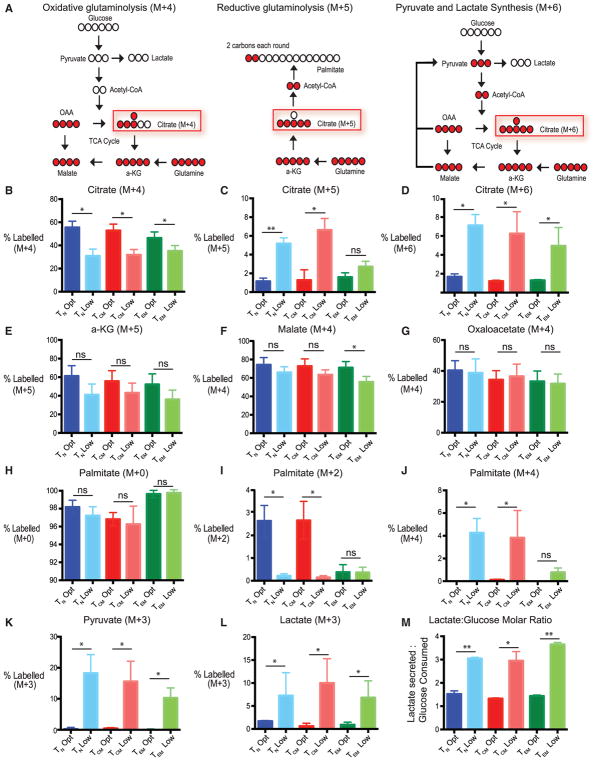
Figure 5. Effector Memory T Cells Cannot Perform Reductive Glutaminolysis for Fatty Acid Synthesis in Low Glucose.
(A) Model depicting how heavy glutamine is incorporated into citrate in an M+4, M+5, or M+6 manner and how each of those inform how glutamine is routed intracellularly.
(B–D) Indicated T cell subsets were activated with anti-CD3/CD28-coated beads in optimal or low glucose supplemented with heavy glutamine for 48 hr. Percentage of M+4 (B), M+5 (C), or M+6 citrate (D) calculated from the total intracellular citrate pool of each subset by LC-MS is indicated.
(E–G) Indicated T cell subsets were treated as in (B). Graphs show percentage of M+5 α-ketoglutarate (E), M+4 malate (F), and M+4 oxaloacetate (G) calculated from the total respective intracellular pools of each metabolite for each subset by LC-MS.
(H–J) Indicated T cell subsets were treated as in (B). Percentages of M+0 (H), M+2 (I), and M+4 palmitate (J) were calculated from the total intracellular pool of palmitate for each subset by LC-MS.
(K and L) Indicated T cell subsets were treated as in (B). Percentage of M+3 pyruvate (K) and M+3 lactate (L) from the total respective intracellular pool of each subset by LC-MS is indicated.
(M) Ratios of lactate secreted and glucose consumed were calculated from moles of lactate secreted and moles of glucose consumed in supernatant of T cell subsets determined by HPLC 48 hr post-activation.
Error bars reflect SEM. All data are representative of 3–4 independent experiments. See Figure S6 for overall relative metabolite abundances of each subset. *p < 0.05, **p < 0.01, paired two-tailed Student’s t test; ns, not significant.

