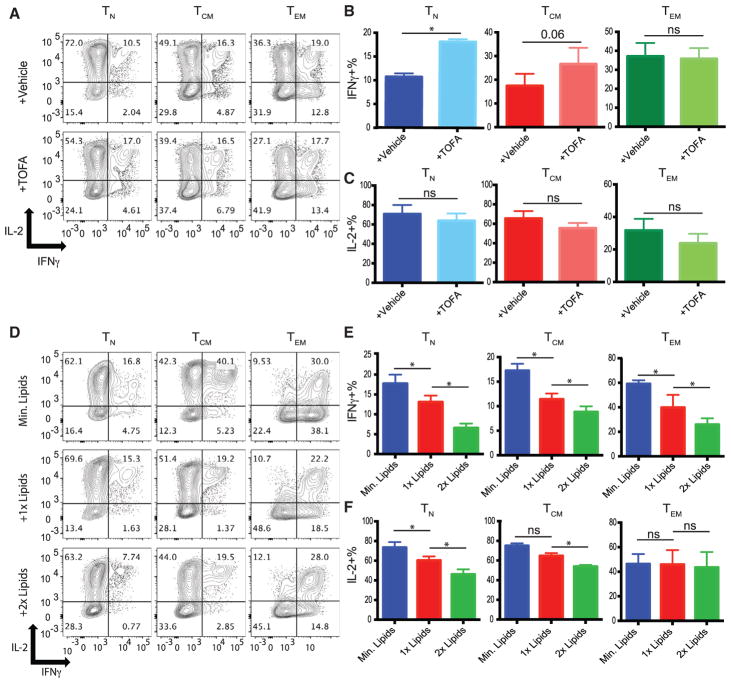
Figure 7. Reliance on Fatty Acid Metabolism in Low Glucose Inhibits IFN-γ Production.
(A) Indicated T cell subsets were activated with anti-CD3/CD28-coated beads in low glucose in the presence of vehicle (DMSO) or low-dose TOFA for 5 days before IFN-γ and IL-2 production was measured after PMA/ionomycin treatment. For optimal glucose data, see Figure S7.
(B and C) Quantification of IFN-γ (B) and IL-2 (C) production from 4 independent experiments.
(D) Indicated T cell subsets were activated with anti-CD3/CD28-coated beads in low glucose in the presence of minimal, 1×, or 2×exogenous lipid concentrate in fat-free medium for 5 days post-activation before IFN-γ production was measured following PMA/ionomycin treatment.
(E and F) Quantification of IFN-γ (E) and IL-2 (F) production from 3 independent experiments.
Error bars reflect SEM. *p < 0.05, **p < 0.01, paired two-tailed Student’s t test; ns, not significant.

