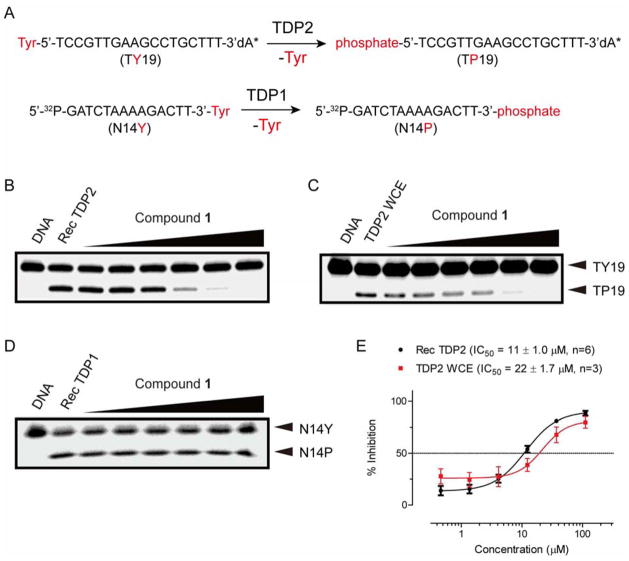
Figure 2.
(A) Schematic representation of TDP2 and TDP1-catalyzed phosphotyrosyl cleavage reaction. Representative inhibition gels of compound 1 against Rec TDP2 (B), TDP2 WCE (C) and TDP1 (D). (E) Dose-response curves of 1 against Rec TDP2 and TDP2 WCE expressed as mean ± SD. Testing concentrations: 0.46, 1.4, 4.1, 12.3, 37 and 111 μM.

