Figure 2.
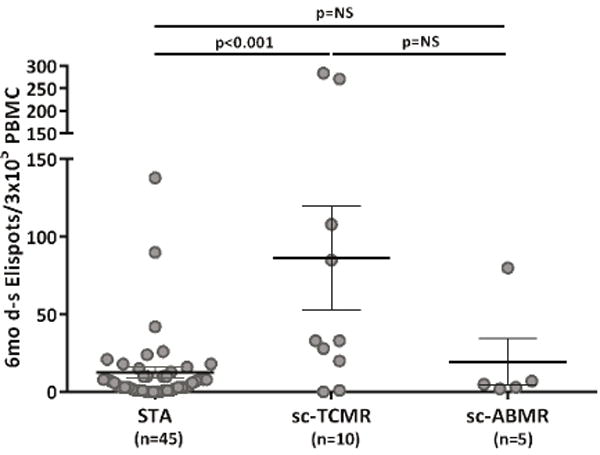
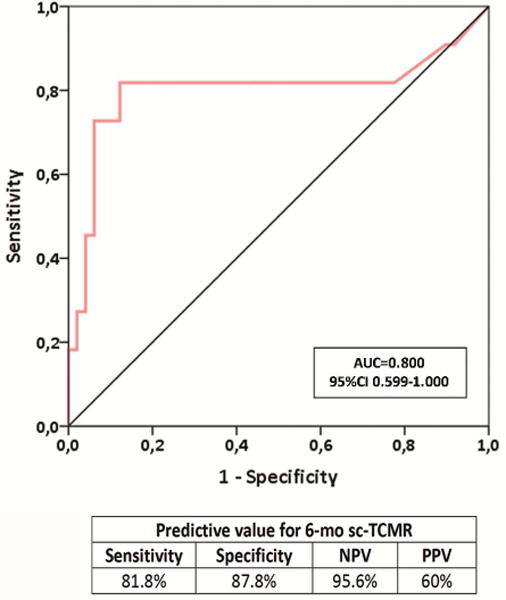
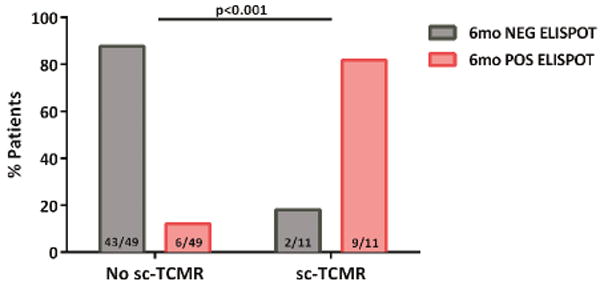
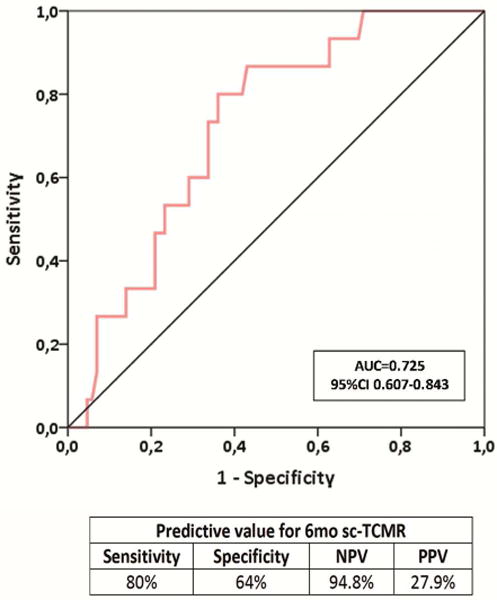
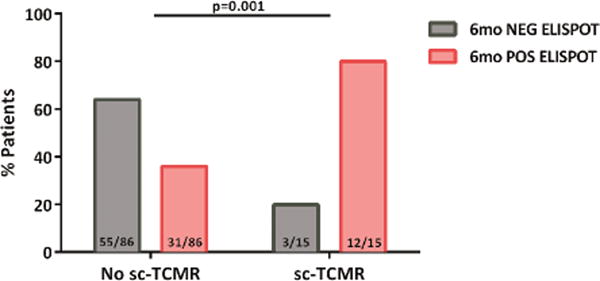
Six-month d-sp T-cell alloreactivity discriminates patients with sc-TCMR at 6-mo protocol biopsies (Discovery Set, n=60 and Validation set, n=90).
2a. Six-month d-sp IFN-γ-producing T-cell frequencies in patients with sc-TCMR and sc-ABMR as compared to STA patients (Discovery Set, n=60). Patients displaying sc-TCMR showed significantly higher frequencies of IFN-γ d-sp secreting T cells compared to patients without sc-TCMR (86.30±33.64 vs 12.49±3.61 IFN-γ spots/3×105 PBMC, in sc-TCMR vs STA, p<0.001; 86.30±33.64 vs 19.40±15.17 IFN-γ spots/3×105 PBMC in sc-TCMR vs sc-ABMR, p=NS; 19.40±15.17 vs 12.49±3.61 FN-γ spots/3×105 PBMC, in sc-ABMR vs STA, p=NS; range 0-138 in STA patients, range 0-284 in sc-TCMR patients and range 2-80 in sc-ABMR patients). ELISPOT results from the one subject with mixed cellular and antibody sc-AR (80/3×105) were similar to that of subjects with sc-TCMR (86.30±33.64 IFN-γ spots/3×105 PBMC). Some spots are jittered as there were several overlapping results, many of them very low. Results are shown as mean spot numbers ±SD.
2b. ROC curve analysis of the d-sp IFN-γ ELISPOT assay predicting sc-TCMR in a discovery set of kidney transplant patients (n=60). A frequency of 19 IFN-γ-producing T cells per 3×10⁵ stimulated PBMC, was shown as the most accurate cut-off value discriminating sc-TCMR at 6-month protocol biopsies (AUC=0.800; 95% CI 0.599-1.000, p=0.002), with 81.8% sensitivity, 87.8% specificity, 95.6 of NPV and 60% of PPV.
2c. Distribution of patients showing sc-TCMR according to the d-sp IFN-γ ELISPOT at 6 months (Discovery Set, n=60). Most patients with sc-TCMR displayed a positive d-sp IFN-γ ELISPOT 9/11(81.8%), whereas those without showed a negative test 43/49(87.8%) (p<0.001).
2d. ROC curve analysis of the d-sp IFN-γ ELISPOT assay predicting sc-TCMR in an independent validation cohort of kidney transplant patients (Validation set, n=101). The assay showed an AUC=0.725, 95% CI 0.607-0.843; p=0.006, with 80% sensitivity, 64% specificity, 94.8% of NPV and 27.9% of PPV.
2e. Distribution of patients showing sc-TCMR according to the d-sp IFN-γ ELISPOT at 6 months. Most patients with sc-TCMR displayed a positive d-sp IFN-γ ELISPOT (12/15(80%), whereas those without showed a negative test 55/86(64%) (p=0.001).
