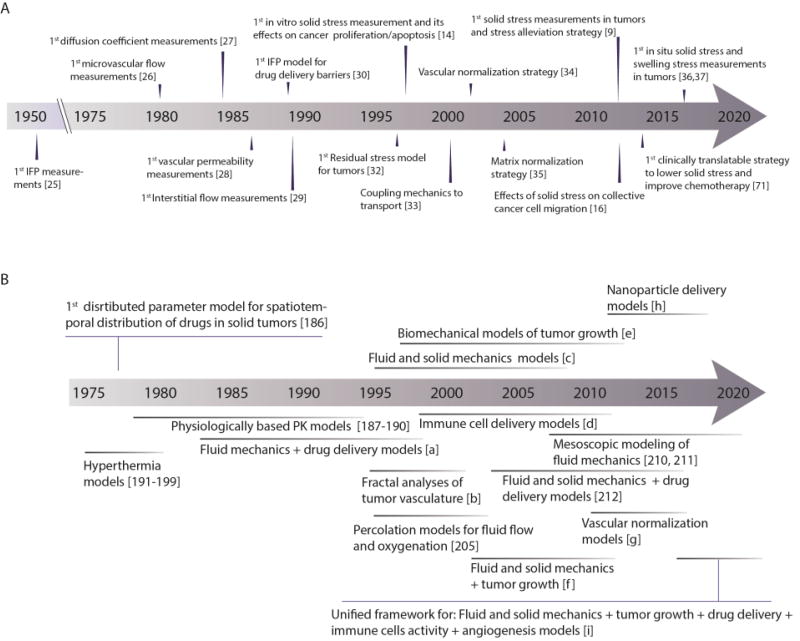
Figure 2. Chronology of measurements of physical parameters in tumors and evolution of mathematical models in our research.
(A) Timeline of first measurements of physical and physiological parameters of tumors, their relation to drug delivery in tumors, and strategies to reengineer the tumor microenvironment to improve therapy. (B) Timeline of the evolution of mathematical models throughout our research. Symbols: [a]= [18, 19, 72, 113, 200], [b]=[5, 104, 204], [c]= [14, 33, 146, 201–203], [d]= [131, 206–211], [e]=[9, 32, 42], [f]=[12, 55], [g]= [109, 162, 172], [h]= [82, 109, 110, 123, 124], [i]=[162, 213].

