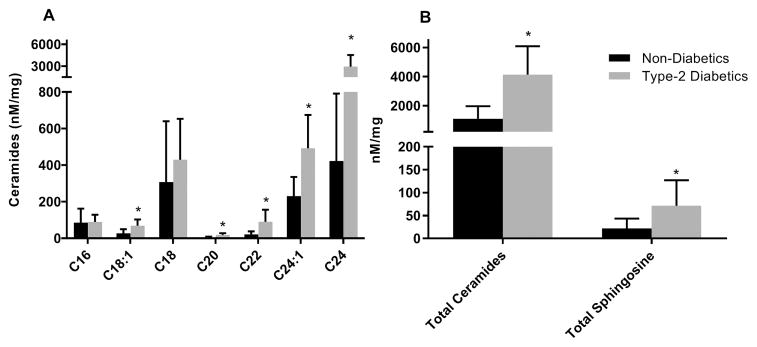
Figure 1. Comparison of ceramides between non-diabetic (black) and type 2 diabetic patients (gray) (mean ± SD).
Panel A: Comparison of ceramide species between diabetics and non-diabetics. Panel B: Comparison of total ceramides and total sphingosine between diabetics and non-diabetics. All values were normalized for protein content. Statistical significance (*= p<0.05) was assessed after adjustment for sex, age, and BMI. FFA = free-fatty acid, IMCL = intramyocellular lipids.

