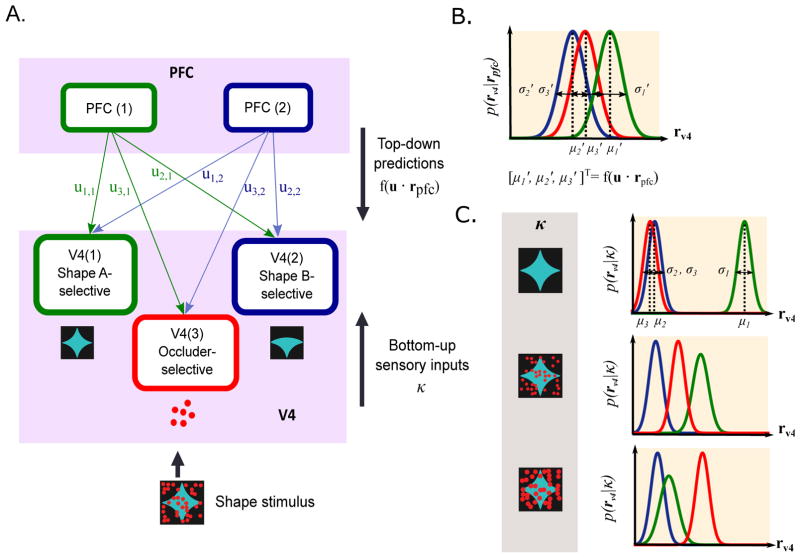
Figure 1.
Schematic diagram of network model. (A) Model network of V4 and PFC populations and the schematic of the input shape stimulus. By optimizing the cost function with respect to both V4 and PFC responses, the network implements both feedforward connections from V4 to PFC and feedback connections from PFC to V4. Note that the model is not image computable, and the input stimulus in the figure is given to illustrate the model setup. (B) Top-down predictions made by PFC on each of the three V4 units are represented by Gaussian distributions with means at f(u · rpfc) = u · rpfc. (C) Bottom-up component, which is represented by the conditional probability distributions of the V4 responses given the shape stimulus. When the input stimulus is unoccluded shape A, the response distribution of the shape A-selective V4 population has a higher mean than those of the shape B- and occluder-selective populations. As the occlusion level increases, the mean of the shape A-selective response distribution decreases and the standard deviation increases. Shape B-selective distribution stays at the constant baseline and the occluder-selective response distribution moves towards higher rates. The response distribution of each V4 population is shown in the same color as in (A).

