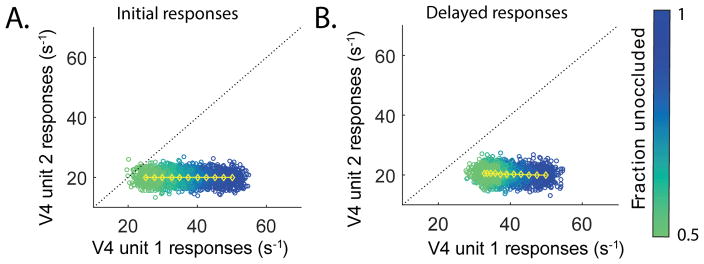
Figure 6.
Shape discriminability under occlusion increases with the top-down prediction. The optimal average firing rates across degrees of occlusion as in Fig. 4D (yellow), projected onto the state space of V4 unit 1 (preferred) and unit 2 (non-preferred) responses. For each occlusion level, 200 responses were generated with a white noise with the mean at the optimal average value (yellow) and standard deviation of 2 arbitrary chosen for illustration purpose (blue: low occlusion, green: high occlusion). When the population responses are under the unity line (dotted black), rv4,1 > rv4,2, and the animal concludes that the test shape presented is shape A. The opposite is true for rv4,2 > rv4,1. Before the top-down prediction (A), the noisy responses under high occlusion (green dots) lie close to the unity line, obscuring the shape identity. With the top-down prediction included (B), the average optimal responses to occluded stimuli are moved horizontally to larger rv4,1 values (yellow). Thus the noisy responses are more squeezed and moved away from the unity line, clarifying the shape identity.

