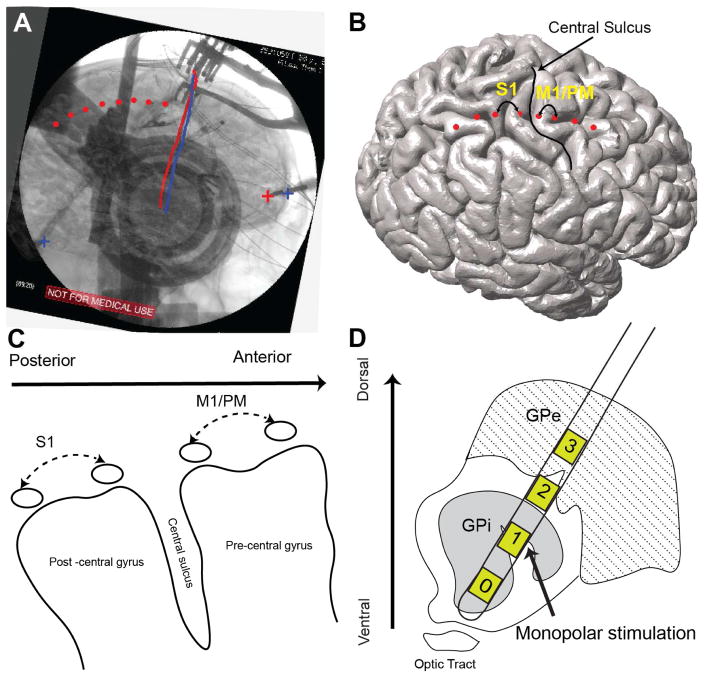
Figure 1.
Localization of cortical ECoG strip and cortical signals used for analysis (A) registration of pre-operative structural high resolution T1 weighted MRI and CT to co-localize cortical brain surface and skull. Tips of stereotactic frame and DBS leads (marked by + signs and straight red and blue lines on the image, respectively) are used as landmark to complete 2D–3D fusion of fluoroscopic image and cortical surface. One the fusion is complete cortical contacts (visible on the fluoroscopic image) are marked manually on the fused images. (B) Marked ECoG contacts are illustrated on the cortical surface and relative to central sulcus. (C) Two cortical bipolar signals spanning post to pre central gyri (S1 and M1/PM) are marked and used for all of the analyses. (D) DBS lead (Medtronic model 3387) penetrating through pallidum. Monopolar channel 1 or 2 was used to deliver high frequency stimulation. (For more detailed description of the registration method please refer to the online supplementary material)

